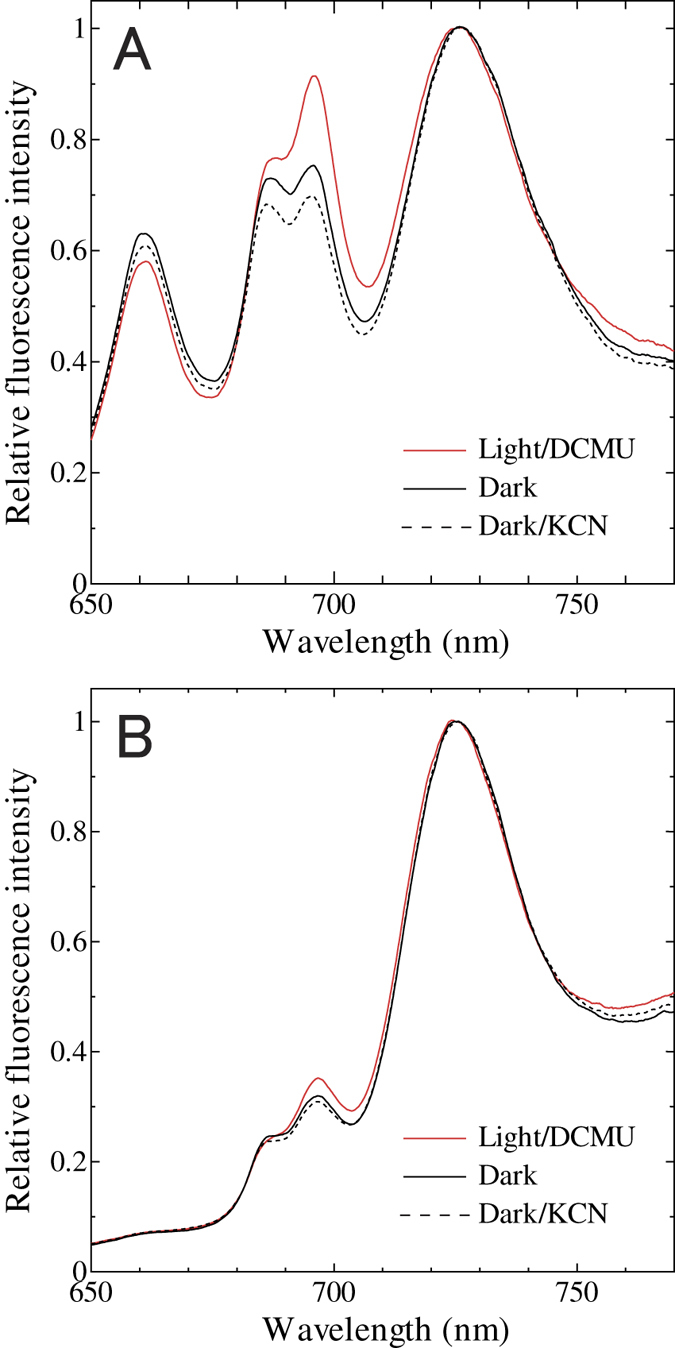
Figure 1.

Chlorophyll fluorescence emission spectra determined at 77 K with phycocyanin excitation at 625 nm (A) or chlorophyll excitation at 435 nm (B). Black solid line, dark-adapted cells without any addition; black dotted line, dark-adapted cells in the presence of 1 mM KCN; red solid line, illuminated cells in the presence of 10 μM DCMU. Averages of spectra with three independent cultures are presented.
