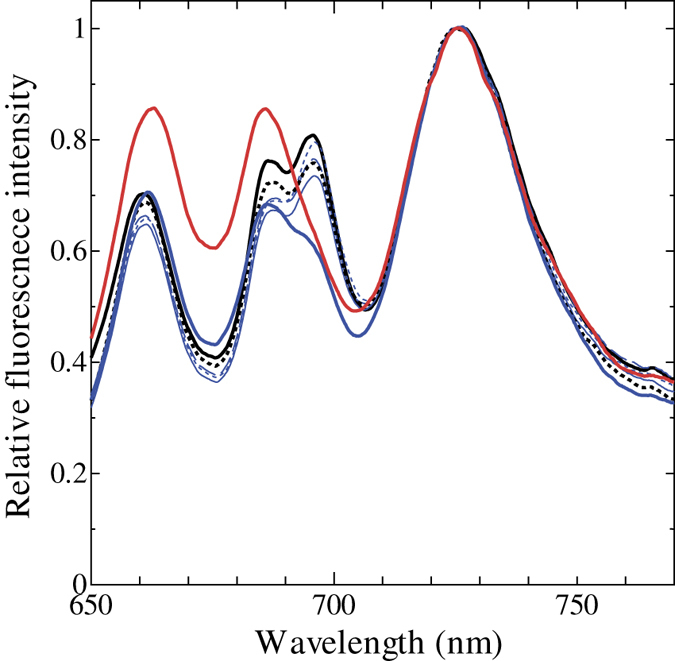
Figure 5. Effects of high light on 77 K chlorophyll fluorescence emission spectra with phycocyanin excitation at 625 nm.

Black solid line, dark-adapted cells; black broken line, cells treated with illumination at 500 μmol m−2 s−1 for 180 min, blue lines, cells treated with 1200 μmol m−2 s−1 for 4 min (dotted line), 30 min (dashed line), 60 min (thin line) and 180 min (bold line); red line, cells treated with 2000 μmol m−2 s−1 for 180 min. Averages of spectra with three independent cultures are presented.
