
Figure 4.
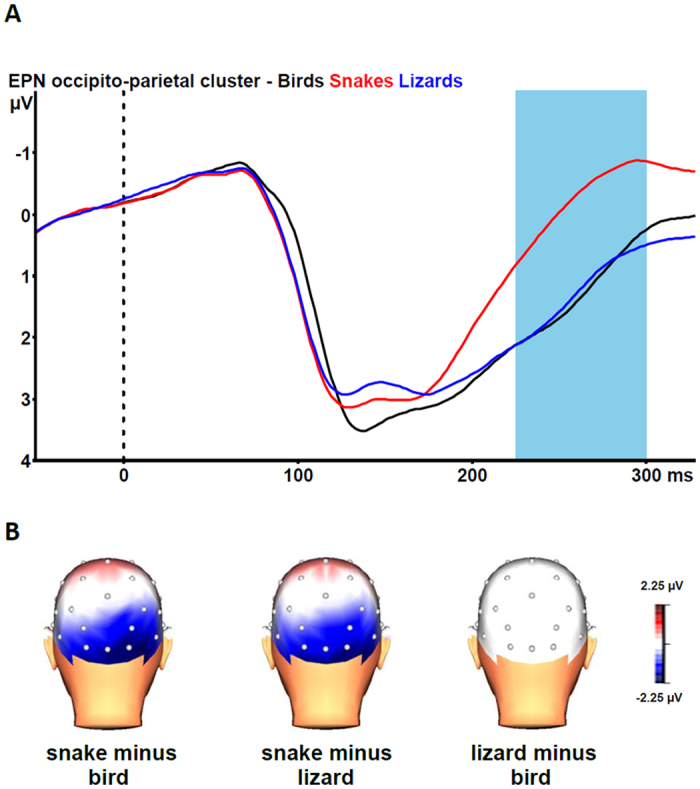
(A) Grand-average waveforms for the early posterior negativity (EPN) in response to pictures of partly exposed snakes (red line), lizards (blue line), and birds (black line) at the occipito-parietal cluster (collapsed across O1, Oz, O2, PO3, PO4, P7, P8). The vertical bar depicts the EPN time window. (B) Grand-average topographic maps of the differences in the 225–300 ms mean area amplitudes between pictures of partly exposed snakes vs. birds (left), snakes vs. lizards (middle), and lizards vs. birds (right). 3D head view created with BrainVision Analyzer 2.1, Brain Products GmbH, Gilching, Germany.