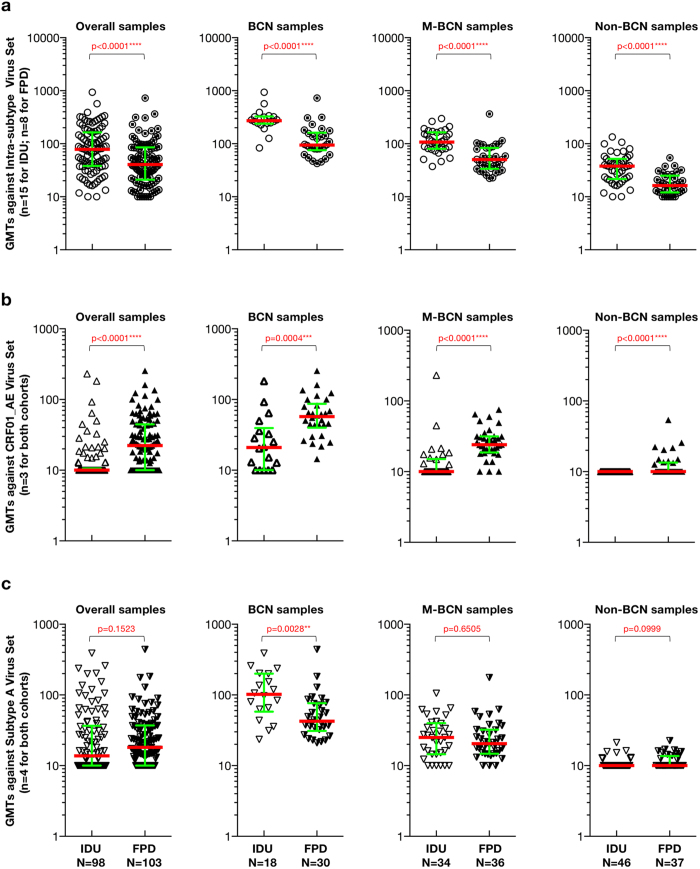
Figure 2. Comparison of NAb potency against the intra-subtype virus (a), CRF01_AE virus (b) and subtype A virus (c) between FPD and IDU cohort.
The difference of GMTs of intra-subtype (a), CRF01_AE (b) and subtype A (c) virus set between IDU and FPD cohort is displayed for the different sample population. P-values (two-tailed) are based on the Mann-Whitney U test. The error bars show the median with the interquartile range. The significant difference between each group is indicated: *0.01 < P < 0.05; **0.001 < P < 0.01; ***P < 0.001; ****P < 0.0001 (Mann-Whitney U test).

