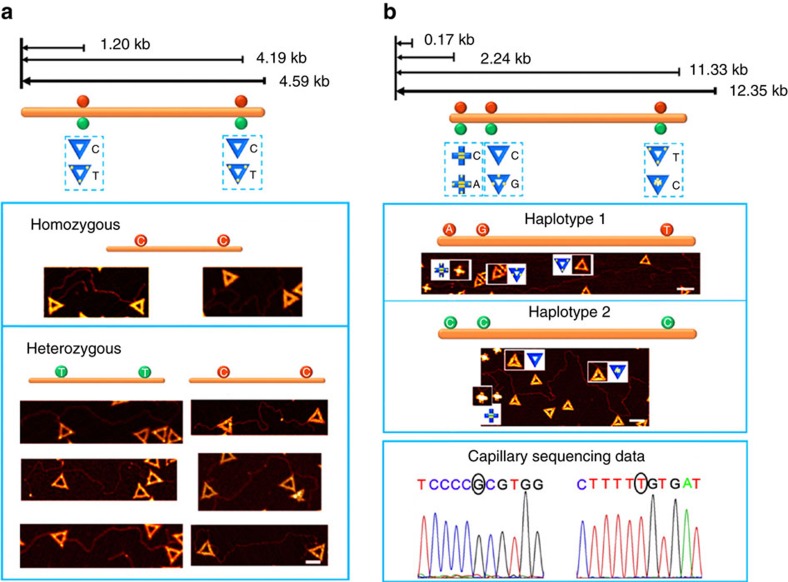
Figure 5. Single-molecule haplotyping.
(a) Upper, schematic showing of genotypes and relative locations of two SNPs on a 4.6 kb region. SNP loci rs17038640 (C/T) and rs4676487 (C/T) are 1.20 and 4.19 kb away from one end of the region. Lower, AFM images show that the genomic DNA of one sample is homozygous at both loci (C–C) and the genomic DNA of the other three samples is heterozygous at both loci (T–T and C–C). For each SNP locus, the triangular- and the STV-decorated triangular-shaped IDs are employed to label the alleles C and T, respectively. Scale bar, 100 nm. (b) Single-blinded test for haplotying P53 gene. Upper, schematic showing of a 12 kb region of the human p53 gene located on the chromosome 17. Each origami shape ID corresponds to a specific allele. For example, for the SNP 1, A and C allele correspond to cross origami with or without STVs, respectively. Middle, AFM images for the haplotypes of these three SNPs. Haplotype 1 contains A–G–T and haplotype 2 contains C–C–C. Lower, when the first SNP was A on one sequence, the other SNPs obtained from independent capillary sequencing were G and T, which was consistent with that from the nanomechanical imaging in haplotype 1. Scale bar, 200 nm.

