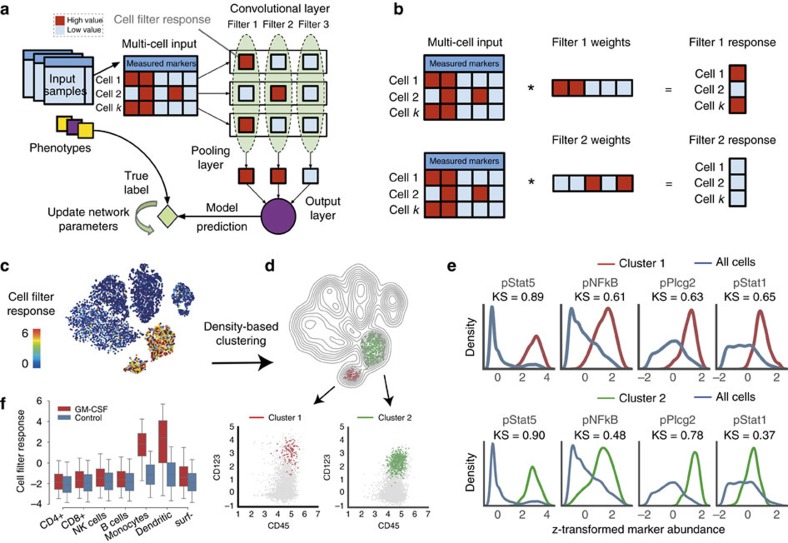
Figure 1. CellCnn overview and demonstration.
(a) CellCnn convolutional neural network architecture. CellCnn takes as input groups of single-cell measurements (multi-cell inputs), where each group is annotated with a phenotype. Node activities in the convolutional layer are defined as weighted sums over single-cell molecular profiles. Nodes in the pooling layer evaluate the presence (max pooling) or frequency (mean pooling) of specific cell subsets. The output of the network estimates the sample-associated phenotype (e.g., disease condition, expected survival). Network training optimizes weights to match training data set phenotype. Trained filter weights correspond to molecular profiles of relevant cell subsets and allow for assignment of the cell subset membership of individual cells (cell-filter response). (b) Illustration of cell-filter response computations for individual cells. For instance, marker profiles of cell 1 and 3 exhibit perfect/no match with weights of filter 1/2 and therefore result in a high/low (red/blue) cell-filter response. (c) CellCnn classification of GM-CSF (un-) stimulated peripheral blood mononuclear cell populations monitored with mass cytometry. t-SNE28 projection based on all cell type-defining surface markers (not used by CellCnn), coloured by cell-filter response. (d) Density-based clustering of high cell filter-response regions using all cell-type-defining surface markers reveals two distinct cell types, namely monocytes (CD33+) and dendritic cells (CD123+). (e) Histograms of the signalling markers (used by CellCnn) showing greatest differential abundance in terms of the Kolmogorov–Smirnov two-sample test between the whole-cell population and the selected cell subsets. (f) Response of individual cells (grouped by manually gated cell types) is shown for both conditions. Significantly higher cell-filter response for monocytes and dendritic cells in the stimulated sample.

