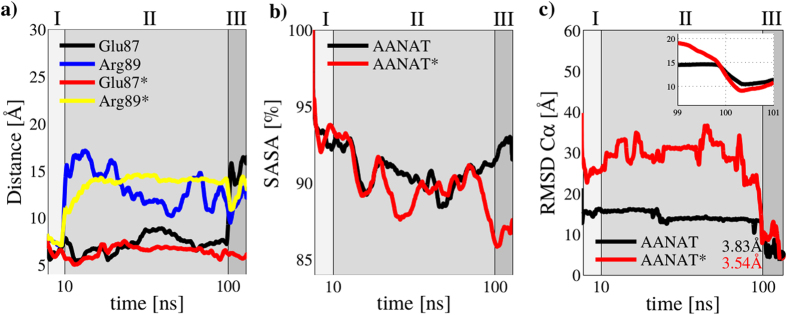
Figure 2. Full molecular dynamics process from initial structures, through pseudo-native to native complex.
(a) Glu87 and Arg89 distance to groups 1 and 2 in 14-3-3ζ (see the methods section). The asterisk means simulation was performed with Thr31 in AANAT in its phosphorylated state (b) Normalized solvent accessible surface area (SASA) of the full protein-protein complex. (c) RMSD Cα to native structure. Sections marked as I, II or III in the plots correspond to first harmonic potential applied (I), free simulation (II) and second harmonic potential applied (III).

