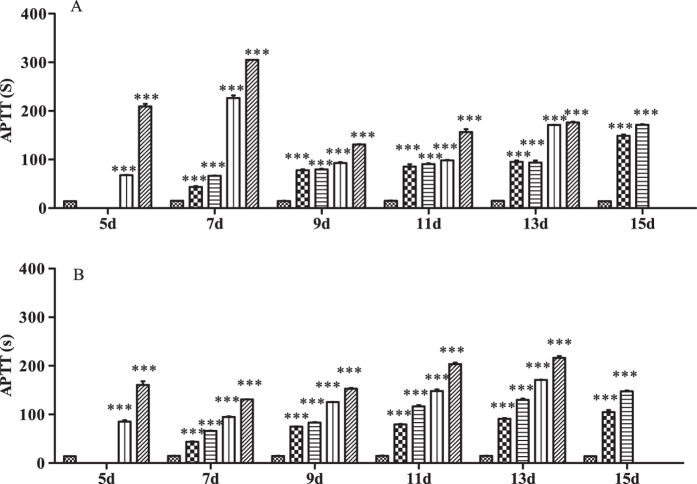
Figure 2. Effect on APTT in rats treated with Na-DHA.
Wistar rats were administered Na-DHA at different doses for 13 days by lavage. APTT values were measured at different times by an automated blood coagulation analyser. (A) Male; (B) female.  Control,
  50 mg/kg;
  100 mg/kg;
  150 mg/kg;
  200 mg/kg. ***p < 0.0 01, significantly different from controls.

