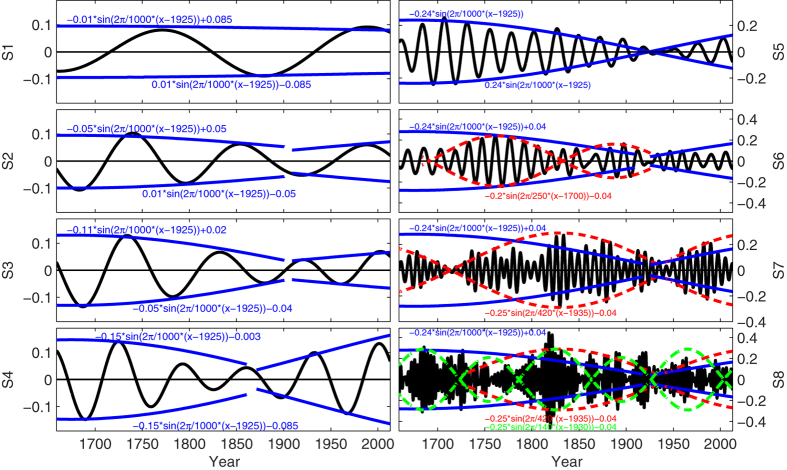
Figure 4. The band-pass filtering for S1-S8, where the black curves indicate the filter signals themselves, while the blue.red and green curves indicate their modulating signals from M1 to M8.
This figure was produced by using the MATLAB version R2010a software (http://cn.mathworks.com).

