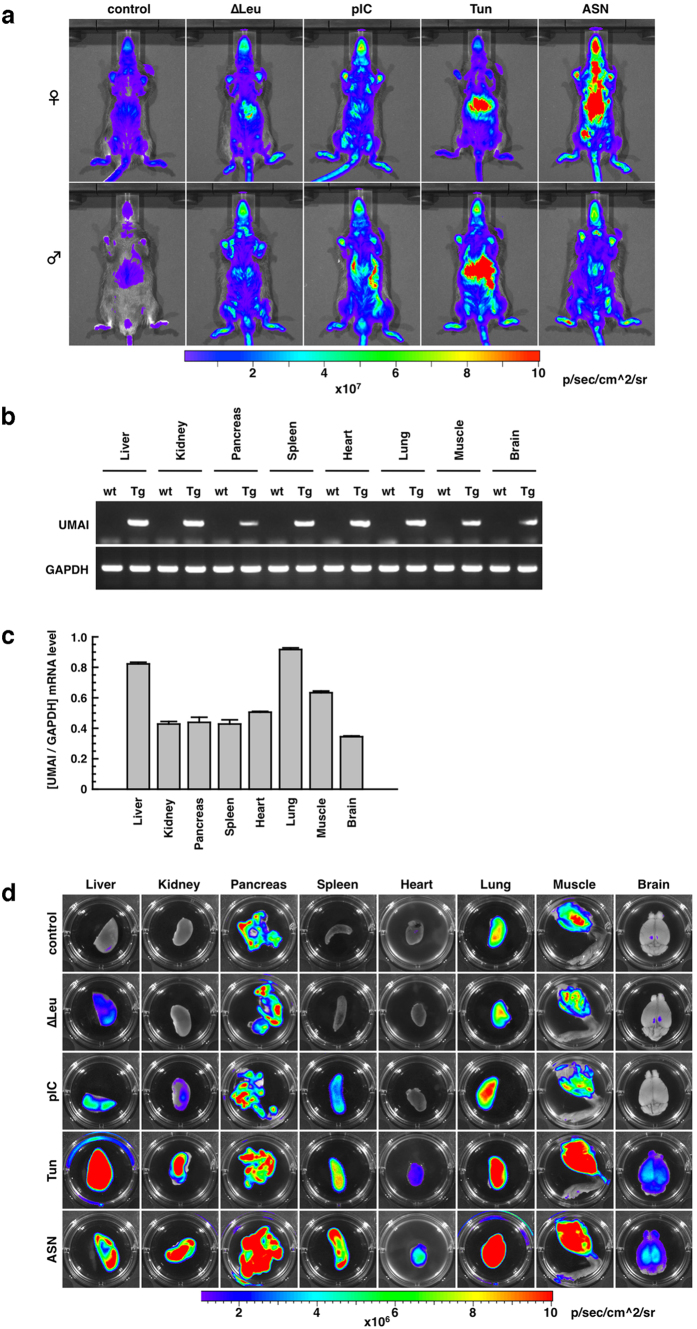
Figure 4. Characterization of UMAI in vivo.
(a) Luminescence signals obtained from UMAI mice (12-week-old) at the F2 generation by in vivo imaging analysis at the whole-body level. (b) RT-PCR analysis of UMAI transgene expression in various tissues. GAPDH was used as an internal standard. Wild type, wt; transgenic, Tg. The tested RNA was extracted from UMAI mice (12-week-old, female) at the F2 generation. (c) Quantitative PCR analysis of the transgene expression in various tissues derived from UMAI mice. The tested RNA was extracted from UMAI mice (12-week-old, female) at the F2, F3, and F6 generations. This histogram is shown as mean (column) ± S.E.M (error bar) from 3 samples (F2, F3, and F6). GAPDH was used as an internal standard. (d) Luminescence signals obtained from various tissues of UMAI mice (12-week-old, female) at the F2 generation by ex vivo imaging analysis. The tissues for ex vivo imaging analysis were collected from UMAI mice treated with the various stressors to induce the ISR.

