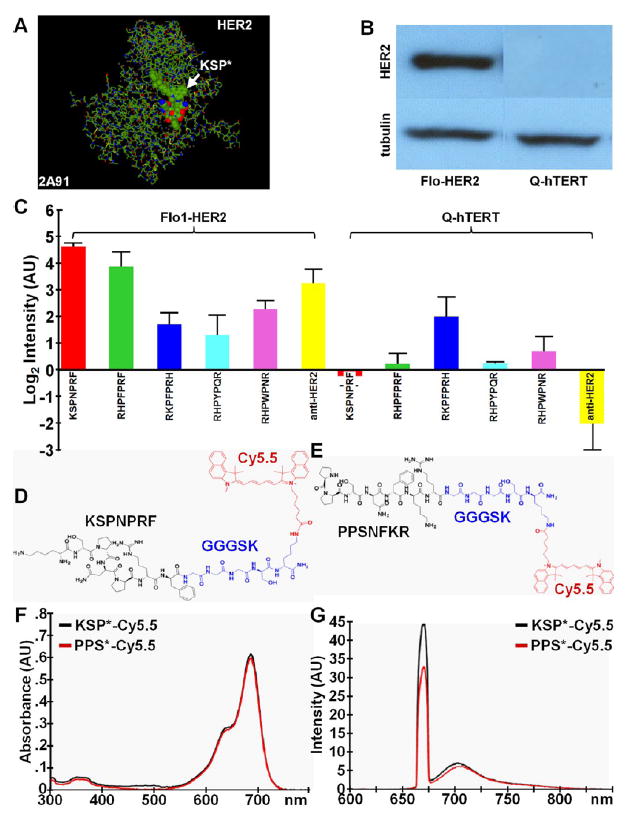
Figure 1.

Selection of peptide specific for HER2. (A) Structural model (2A91) for HER2-ECD was used to evaluate binding interactions between target and candidate peptides. (B) Western blot of Flo1-HER2 and Q-hTERT (control) cells show difference in HER2 expression. (C) Top 5 peptide sequences were FITC-labeled and evaluated with confocal microscopy with cells in vitro. KSPNPRF showed the highest mean fluorescence intensity compared with the other peptides. Data was transformed to log base 2. (D) Chemical structure of KSPNPRF peptide (black) labeled with Cy5.5 fluorophore (red) via a GGGSK linker (blue); KSP*-Cy5.5. (E) Scrambled control peptide PPSNFKR; PPS*-Cy5.5. (F) Peak absorption occurs at λex = 680 nm and (G) maximum fluorescence emission is seen at 708 nm for both peptides.
