Figure 6.

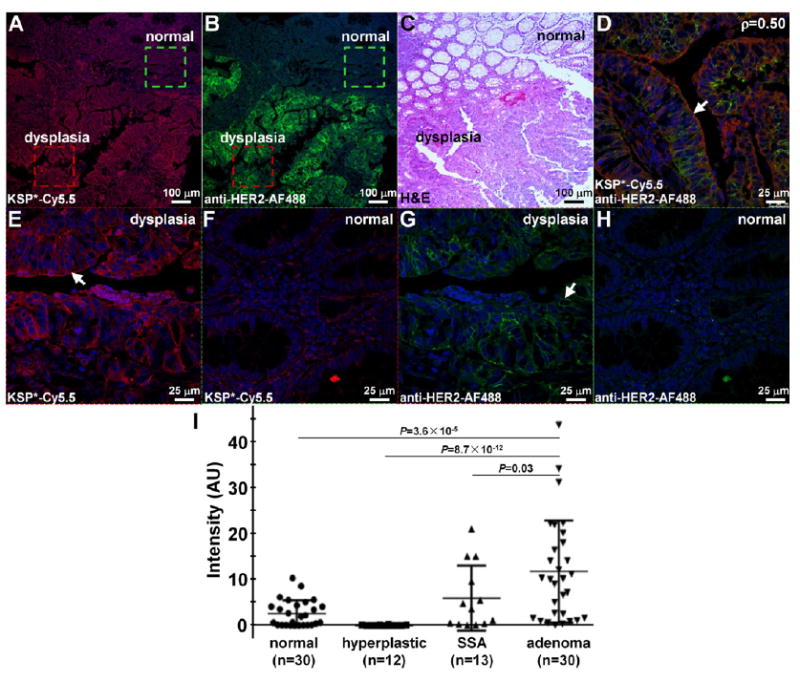
Validation of specific peptide binding to HER2 overexpressed by human proximal colonic neoplasia. Increased fluorescence intensity was observed for staining of (A) KSP*-Cy5.5 (red) and (B) anti-HER2-AF488 antibody (green) to human colonic dysplasia. (C) Corresponding histology (H&E) from adjacent section. (D) Co-localization of binding (arrow) by peptide (red) and antibody (green) in dysplasia is shown, Pearson’s correlation coefficient p = 0.50. High magnification image of dashed red and green boxes in (A) show increased staining of KSP*-Cy5.5 peptide (red) to (E) cell surface in dysplasia (arrow) versus (F) normal. High magnification image of dashed red and green boxes in (B) show increased staining of anti-HER2-AF488 antibody (green) to (G) dysplasia versus (H) normal. (I) Quantified results showed mean (±sem) intensities to be 2.72 ± 0.31, 0.12 ± 0.08, 6.07 ± 0.73, and 11.9 ± 0.61 for normal (n = 30), hyperplastic polyps (n = 12), sessile serrated adenomas (n = 13), and sporadic adenomas (n = 30), respectively. The P-values for differences in the mean results for sporadic adenomas and that for normal, hyperplastic polyps, and sessile serrated adenomas were P = 3.6 × 10⁻⁵, P = 8.7 × 10⁻¹², and P = 0.03, respectively, by Tukey’s multiple comparisons. The difference between the mean intensities for SSA and normal colon was P = 0.20.
