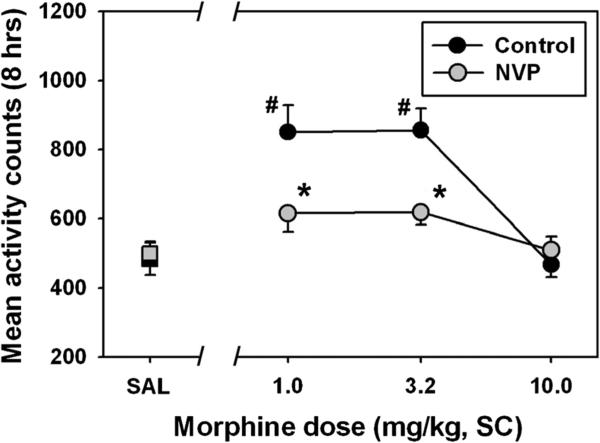
Fig. 4.
Acute effects of morphine on locomotor activity (summed over 8 h after injection) in control (black) and NVP (gray) rats, as measured in a home cage setting using radiotelemetry. Abscissa, injection condition, where SAL represents a control session where saline was administered, or where various doses of morphine were injected. Ordinate, mean (±SEM) locomotor counts recorded. Hash marks indicate significant differences from the appropriate saline control condition, while asterisks indicate significant differences from control at that dose, as determined by twoway repeated measures ANOVA and Holm–Sidak's multiple comparisons test (p<0.05)

