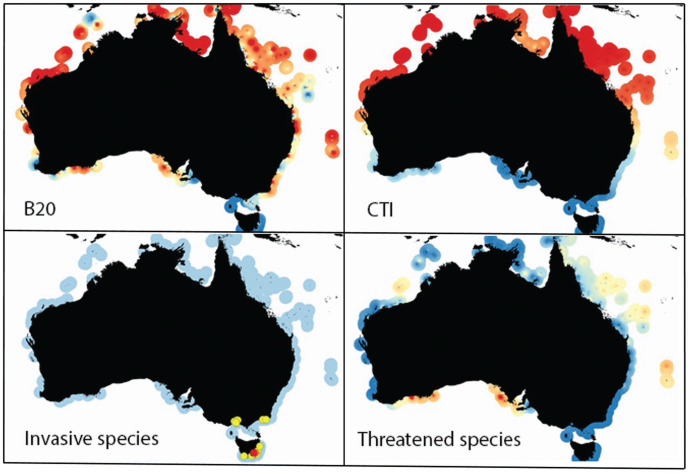
Figure 2.
The distribution of values of indicators of reef biodiversity in relation to fishing pressure, ocean warming, invasive species, and threatened species, based on quantitative surveys of coral and rocky reefs by the Reef Life Survey program (n = 1294 sites). B20 is the total biomass of fishes 20 centimeters or larger, and CTI is the community temperature index. The CTI is calculated as a community-weighted mean of the midpoint of the realized thermal range of each species, weighted by the log of their abundance. It represents the current mean thermal affinity of reef fish communities rather than implying any warming-related change (shown in figure 3). Invasive species were only plotted for sites at which they were recorded, with yellow indicating up to 30% of individuals belonging to invasive species and red indicating values from 30% to 95% of individuals. Otherwise, the color scales are interpreted as red being the highest values in the data set and blue as the lowest (zero for invasive and threatened species). The values have been interpolated and extended to a maximum of 100 kilometers from the survey sites to enable visualization of a broader strip of color around the coastline (see supplemental material). The values only apply to shallow reef habitats within the colored areas of the maps.

