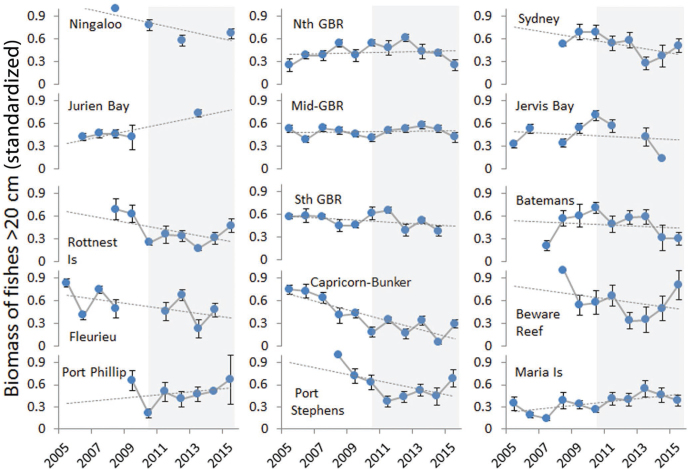
Figure 3.
Trends in biomass of large reef fishes (20 centimeters or greater) at monitoring locations from 2005 to 2015. The values for each site have been standardized by the maximum for that site over the time series, and the means of the standardized values among a number of sites at each location are shown (overall mean of 23 sites per location per year). The error bars represent the standard error. Long-term trends shown by the dotted gray line are linear smoothers, and background shading provides a visual reference to the middle of the period covered (5 years). The locations at which marine protected areas (MPAs) were monitored include sites within and outside MPA boundaries.

