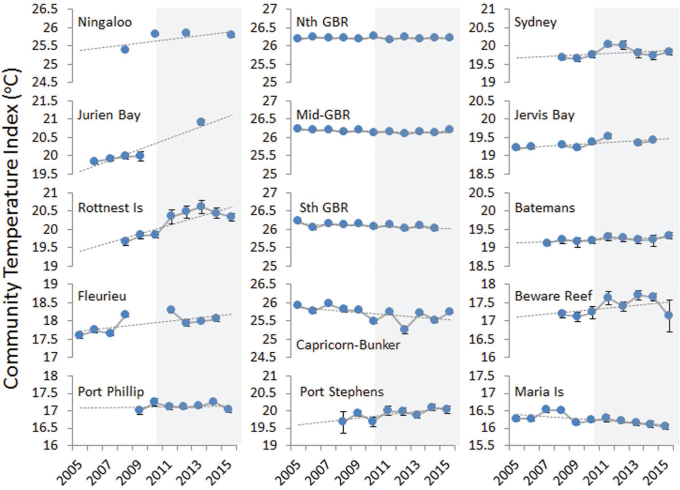
Figure 4.
Trends in the community temperature index (CTI) for reef fishes at monitoring locations from 2005 to 2015. Each point represents the mean (±SE) of CTI values among sites surveyed at each location in that year (overall mean of 23 sites per location per year). The long-term trends shown by the dotted gray line are linear smoothers, and background shading provides a visual reference to the middle of the period covered (5 years). The locations at which marine protected areas (MPAs) were monitored include sites within and outside MPA boundaries.

