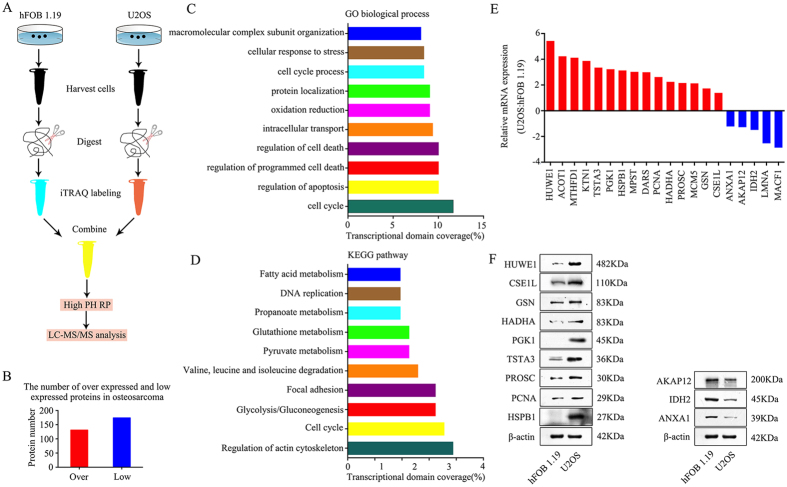
Figure 1. Experimental workflow for quantitative proteomic analysis and findings.
(A) The flow chart for proteomic analysis. (B) The number of upregulated and downregulated proteins identified in osteosarcoma cells. (C) Gene ontology (GO) categories of overlapping genes. (D) Kyoto Encyclopedia of Genes and Genomes (KEGG) pathway analysis showing the top 10 enriched pathways. (E) mRNA expression levels of 15 upregulated and 5 downregulated proteins found in U2OS cells compared to those found in hFOB 1.19 cells as verified by qRT-PCR. (F) Representative blots displaying protein expression of 9 upregulated and 3 downregulated proteins. β-actin was used as an internal control. Full-length gels are presented in Supplementary Figure S7.

