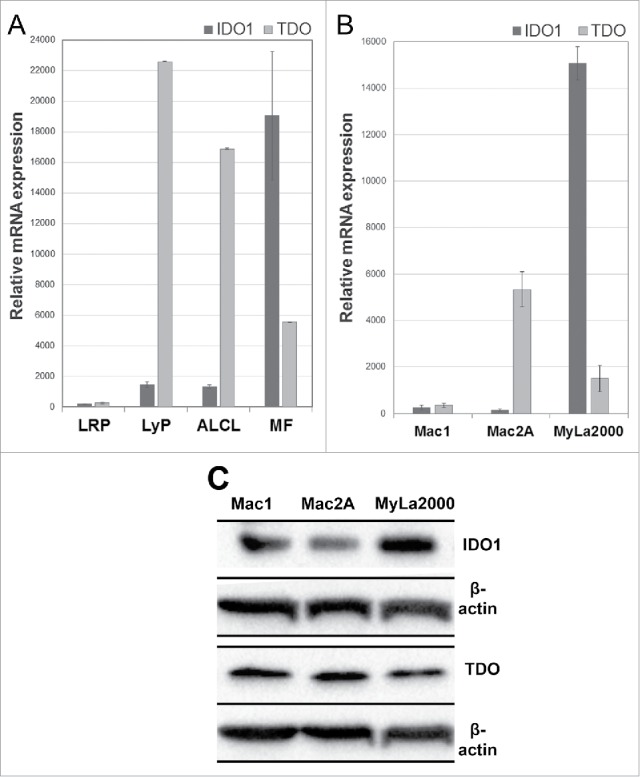
Figure 1.

Gene expression of IDO1 and TDO in CTCL skin specimens and cell lines. Relative mRNA levels in (A) FFPE skin specimens of LRP, LyP, ALCL, MF, and in (B) the cell lines Mac1 (LyP-derived), Mac2A (LyP-derived), and MyLa2000 (MF-derived). mRNA expression levels are presented as mean +/− SD. (C) Western blot analysis of CTCL cell lines. A densitometer was used to evaluate the protein expressions and the adjusted density values for IDO1 and TDO fragments were calculated. MyLa2000 was chosen as calibrator (relative density value 1) and after normalization against β-actin, the adjusted density values for IDO1 in Mac1 and Mac2A cells were 0.48 and 0.4, respectively. Likewise, the corresponding density values for TDO were 1.43 and 1.45, respectively.
