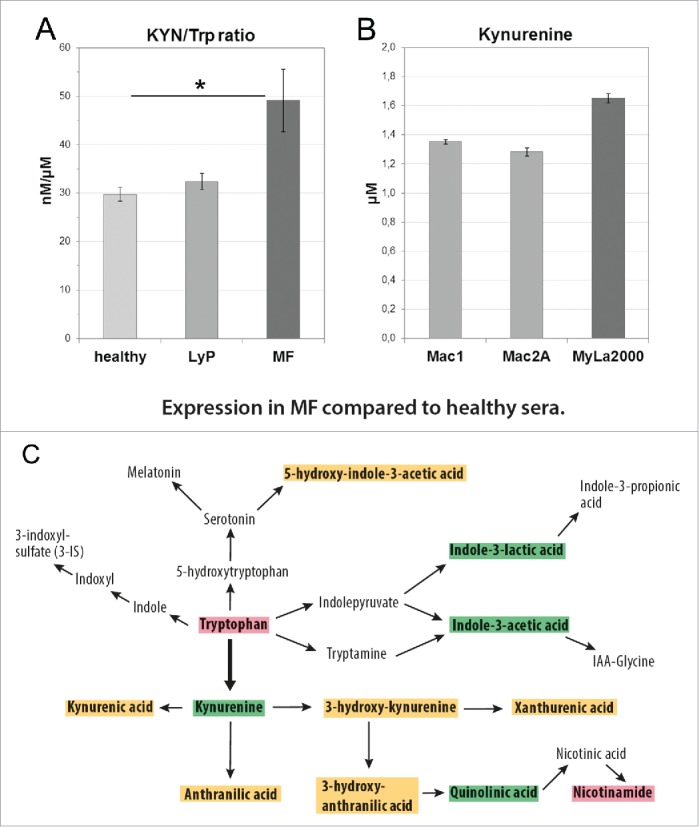
Figure 6.

The activation of the KYN pathway in CTCL. (A) Significant difference in KYN/Trp ratio between healthy controls and MF sera (*p = 0.012), but no statistically significant difference between controls and LyP or between LyP and MF sera (Kruskal–Wallis test). (B) KYN concentrations in supernatants of CD30+ cell lines Mac1 (1.351 µM), Mac2A (1.282 µM), and the MF-derived cell line MyLa2000 (1.650 µM) after 24 h culturing (5000 cells/96-well in 200 µL). (C) A diagram illustrating the significant changes in the concentrations of KYN pathway metabolites in MF compared with healthy sera. Red box indicates that the value is significantly decreased; green is significantly increased and orange means no change (Kruskal–Wallis test).
