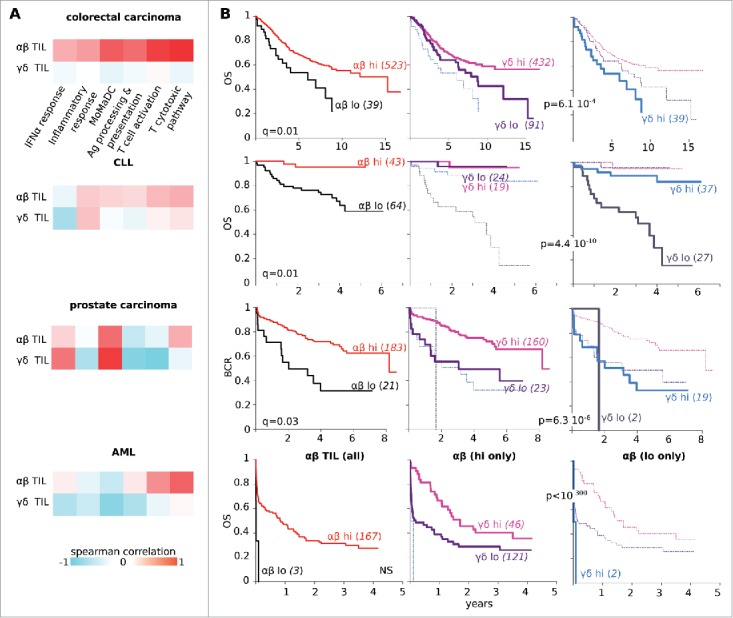
Figure 4.

Different correlates of αβ and TCRVγ9Vδ2+ γδ TIL abundance. (A) In the specified groups of cancer patients, heatmaps of spearman correlation between abundance of αβ TILs (top) or TCRVγ9Vδ2+ γδ TILs (bottom) with SES for the gene sets indicated. The abundance of αβ TILs never shows the same correlation profile as the abundance of TCRVγ9Vδ2+ γδ TILs. (B) Kaplan–Meier plots for the overall survival of colorectal carcinoma, CLL and AML patients or for the biochemical relapse (BCR) of prostate cancer patients, according to the abundance of the αβ TILs only (left), the TCRVγ9Vδ2+ γδ TILs superimposed on the αβ TILs-low only (middle) and the TCRVγ9Vδ2+ γδ TILs on αβ TILs-high only (right). Abundance of both subsets of TILs is associated to favorable outcome in these cohorts of cancer patients.
