
Fig. (5).
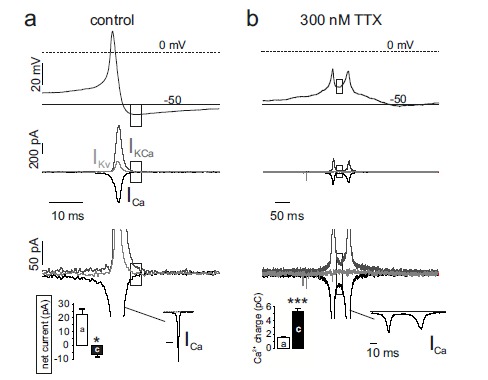
Reducing NaV availability by TTX inverts net current during the AHP from outward to inward. a) Top, AP-clamp experiment showing representative control spike. Middle, Kv currents (ligh grey traces) were measured in a Tyrode standard solution with TTX (300 nM) and Cd2+ (200 μM). Ca2+ currents (black) were measured in the presence of TTX (300 nM) and high extracellular TEA (135 mM). Ca2+-activated K+ currents (dark grey) were obtained by subtracting from a control recording in Tyrode standard with 300 nM TTX the KV and the Ca2+ current. Bottom, close up of the middle panel. The dashed rectangles indicate the AHP phase and the respective currents that sustain it. b) same as for a, using a spike doublet fired after complete block of Nav currents with 300 nM TTX. Bottom-left inset in a: net current amplitudes measured during the AHP phase indicated by the dashed rectangles. Bottom-left inset in b: Ca2+ charge entering the cell during the AHP phase calculated by integrating the corresponding Ca2+ inward current (ICa) shown in full to the right (adapted from ref. [24]).