
Figure 3.
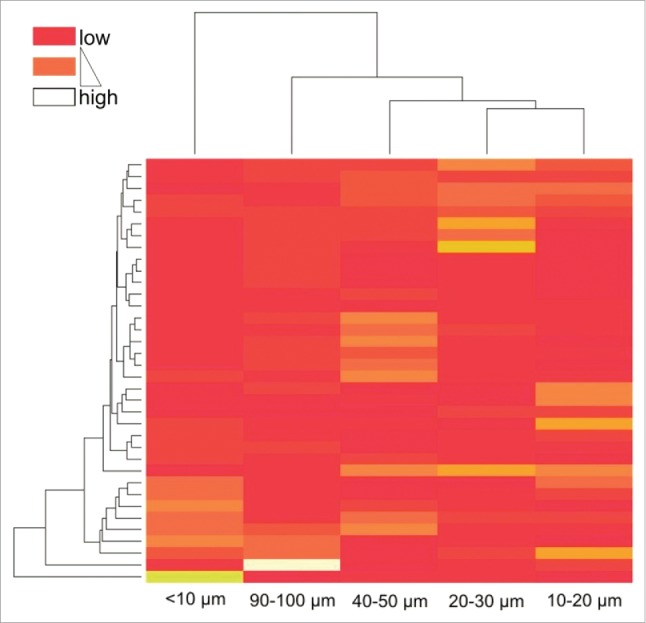
Heatmap based on unsupervised clustering encompassing randomly selected single fields from all 36 patients. Color code indicates clustering of patients according to their relative T cell densities within single distance classes.
Official websites use .gov
A
.gov website belongs to an official
government organization in the United States.
Secure .gov websites use HTTPS
A lock (
) or https:// means you've safely
connected to the .gov website. Share sensitive
information only on official, secure websites.
Heatmap based on unsupervised clustering encompassing randomly selected single fields from all 36 patients. Color code indicates clustering of patients according to their relative T cell densities within single distance classes.