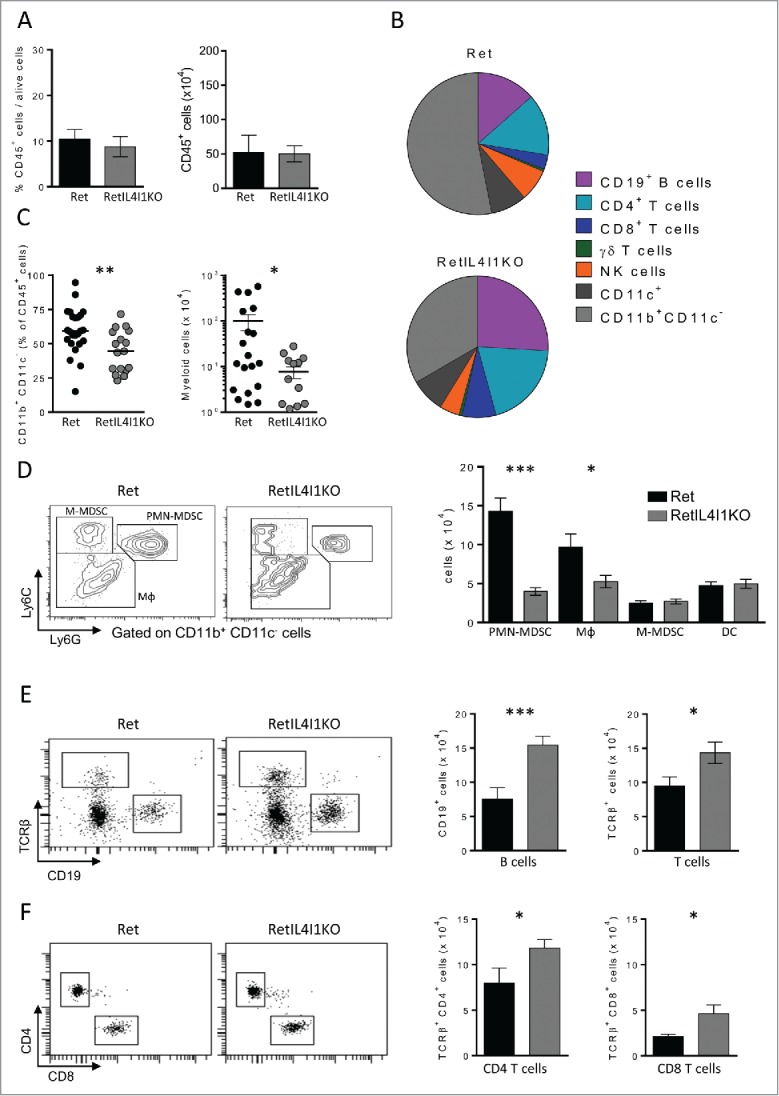
Figure 3.

Remodeling of immune cell infiltration in primary tumor of mice lacking IL4I1. (A) Proportions and absolute numbers of CD45+ cells within primary tumors of 3-mo old Ret and RetIL4I1KO mice. (B) Distribution of immune cells infiltrating Ret (top) and RetIL4I1KO (low) primary tumors. (C) Proportion and absolute numbers of myeloid cells. (D–F) Absolute numbers of DC (CD11c+), MФ (CD11b+CD11c−Ly6C−/lowLy6G−), M-MDSC (CD11b+CD11c−Ly6ChighLy6G−) and PMN-MDSC (CD11b+CD11c−Ly6CintLy6G+) (D) and also CD19+ B cells and TCR+ cells (E) subdivided into CD4+ or CD8+ T cells (F). Representative gating strategies are shown (D, E, F; left). Data are pooled of at least three independent experiments. Mean and SEM. *p < 0.05; **p < 0.01; ***p < 0.001.
