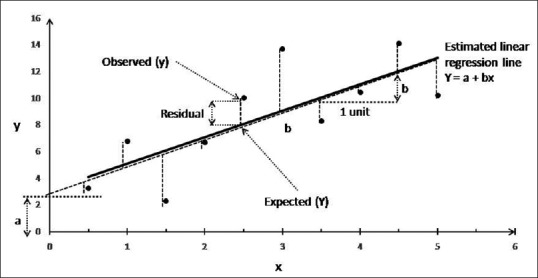
Figure 1.

Data from a sample and estimated linear regression line for these data. Each dot corresponds to a data point, i.e., an individual pair of values for x and y, and the vertical dashed lines from each dot represent residuals. The capital letters (Y) are used to indicate predicted values and lowercase letters (x and y) for known values. Intercept is shown as “a” and slope or regression coefficient as “b”
