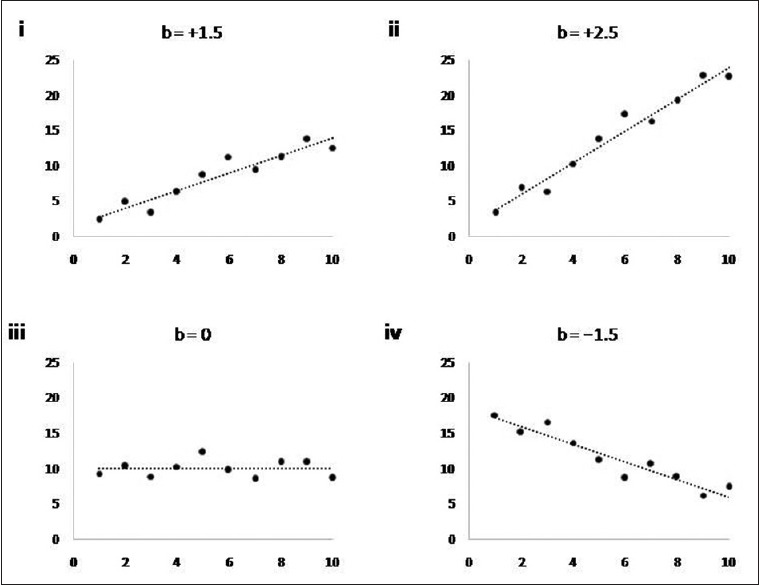
Figure 2.

Relationships between two quantitative variables and their regression coefficients (“b”). “b” represents predicted change in the value of dependent variable (on Y axis) for each one unit increase in the value of independent variable (on X axis). “b” is positive, zero, or negative, depending on whether, as the independent variable increases, the value of dependent variable is predicted to increase (panels i and ii), remain unchanged (iii), or decrease (iv). A higher absolute value of “b” indicates that the independent variable changes more for each unit increase in the predictor (ii vs i)
