
Fig. 3. Dynamics of the system.
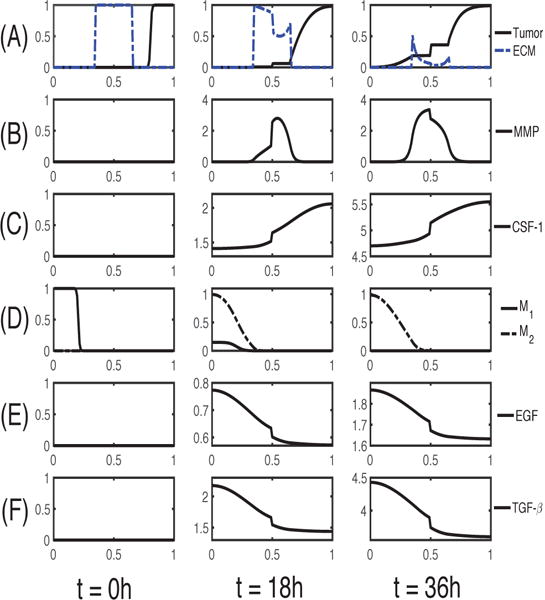
The time evolution of the density of each variable. (A) glioma cells and ECM (B) MMP (C) CSF-1 (D) M1/M2 cells (E) EGF (F) TGF-β. Here, ECM = [0.35, 0.65]. Note that the initial concentrations of CSF-1, EGF and TGF-β are uniformly zero, as in experiments. The x-axis is the dimensionless length across the tumor invasion chamber and the y-axis in each frame is the dimensionless density/concentration of the indicated.