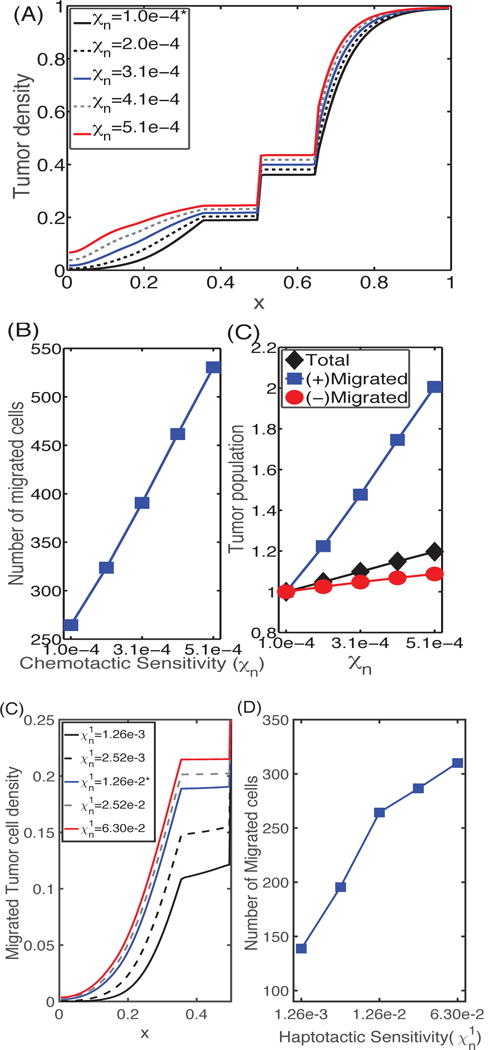
Fig. 6. The effect of chemotaxis and haptotaxis on invasion.

(A) Profiles of the tumor cell density at t = 36 h for different values of the chemotactic sensitivity χn. (B) (left) The number of cells that have migrated, and (right) the relative populations of invasive cells (squares), cells in the upper chamber (circles), and the total number of cells (diamonds) at t = 36 h as a function of chemotactic sensitivity. As χn increases, the number of migrating cells is increased. (C) Profiles of tumor cell densities at t = 36 h for different values of the haptotactic parameter ; (D) The population of migrating cells in the lower chamber as a function of . As the haptotactic parameter increases the tumor cells invade into the region initially occupied by the M1 cells more rapidly. Here and hereafter cell numbers are derived from the continuum density using the total number of cells in [9].
