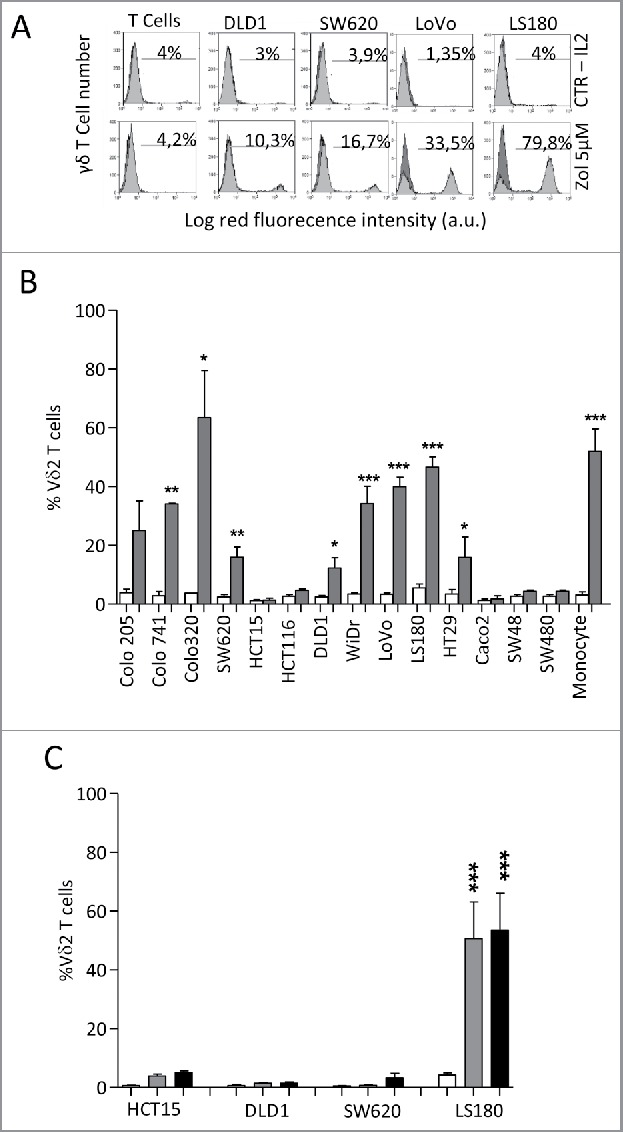
Figure 1.

Vδ2 T cell expansion upon co-culture with CRC exposed to Zol.The CRC cell lines HT29, HCT15, HCT116, SW48, SW620, SW480,Colo741, Colo205, Colo320, CaCo2, LS180, WiDr, LoVo and DLD1were co-cultured for 20 d with peripheral blood T cells from healthy donors, at the T:CRC ratio of 10:1, with 5 µM Zol and IL2 or IL2 alone. (A) percentage of Vδ2 T lymphocytes among one representative T cell population cultured alone (left histograms) and after co-culture with CRC (other panels, four representative CRC cell lines) with Zol (lower row) or IL2 alone (upper row) evaluated with the anti-Vδ2 mAb and FACS analysis. Data are represented as percentage of Vδ2 T cells (light gray histograms) reported in each quadrant. (B) percentage of Vδ2 T lymphocytes after 20 d of co-culture with the indicated CRC cell lines with Zol (gray columns) or IL2 alone (white columns). Data are the mean ± SD from six experiments for each cell line. *p <0.05, **p <0.01, ***p <0.001 vs. co-cultures without Zol. (C) SW620, HCT15, DLD1 and LS180 CRC cell lines were pre-treated (4 h) with high doses (100 µM, black bars, or 50 µM, gray bars) of Zol, washed and co-cultured with purified T cells as above, and evaluated for the percentage of Vδ2 T lymphocytes after 20 d of co-culture. Mean ± SD from six experiments with T cells of six different donors. ***p <0.001 vs. co-cultures without Zol (white bars).
