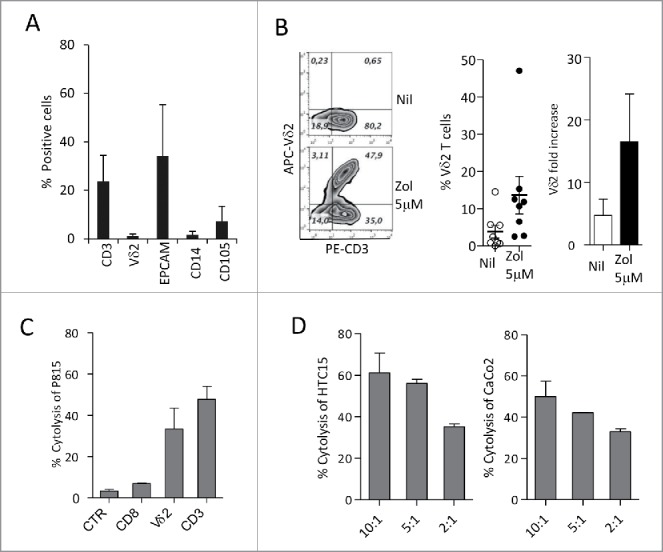
Figure 6.

Differentiation of Vδ2 T cells from ex-vivo CRC cell suspensions. (A) Cell suspensions from CRC were stained with specific anti-CD3, anti-Vδ2, anti-EPCAM, anti-CD14 and anti-CD105 mAbs followed by aAPC-conjugated anti-isotype antiserum and analyzed by flow cytometry. Percentages of positive cells were calculated and results expressed as mean ± SD (n = 10). (B) CRC cell suspensions were cultured in the presence or absence of Zol (5 µM) and IL2 for 20 d, double stained with the specific PE-anti-CD3 and APC-antiVδ2 mAbs and the percentage of positive cells was calculated. Left plots: one representative experiment out of eight. Central histogram: percentage of Vδ2 T cells obtained from CRC cultures without (white) or with Zol (5 µM, black); mean ± SEM of eight experiments. Right histogram: results analyzed as fold increase (percentage of Vδ2 T cells on day 20 vs. day 0, white bar IL2 alone, black bar 5 µM Zol). Mean ± SEM (n = 8). (C and D) Vδ2 T cells obtained from 20 d of CRC cultures, with Zol, were used in re-directed killing assay against the P815 cell line in the presence of the anti-CD8, anti-Vδ2, anti-CD3 mAbs or an unrelated mAb matched for the isotype (CTR) (C) at the E:T ratio of 5:1, or in a 4 h 51Cr release cytolytic assay against the HCT15 or CaCo2 cell lines (D, left and right histograms) at the E:T ratio of 10:1, 5:1 and 2:1. One representative experiment of three is shown. Mean ± SEM of sample duplicate.
