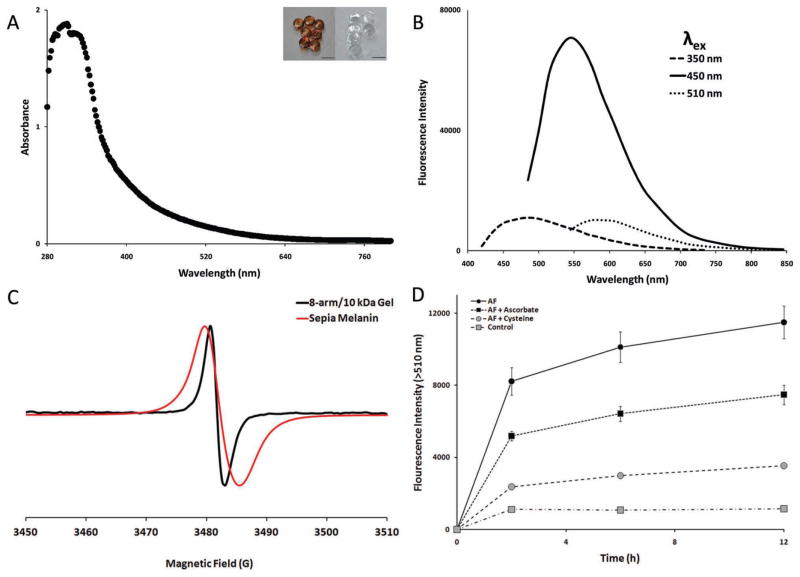
Figure 1.
Characterization of melanin-like properties (A) Characteristic absorbance spectrum for PEG-gallate derived gels. (B) Time course of AF-gel adduct formation. Fluorescence at t = 0 was subtracted at all time points. Each data point represents the mean ± SEM (n = 6). Lines are included to guide the eye. (C) Gel excitation-emission properties at three λex maxima. (D) EPR spectrum for hydrogels and sepia melanin. (inset) Melanic gel drops formed from 7.5 μL of 20 wt% 8-arm/10 kDa macromer solution and equal volume of 0.16M NaIO4 before (left) and after (right) soaking gel drops in 10% Clorox bleach for 5 minutes. Scale bars = 4 mm.

