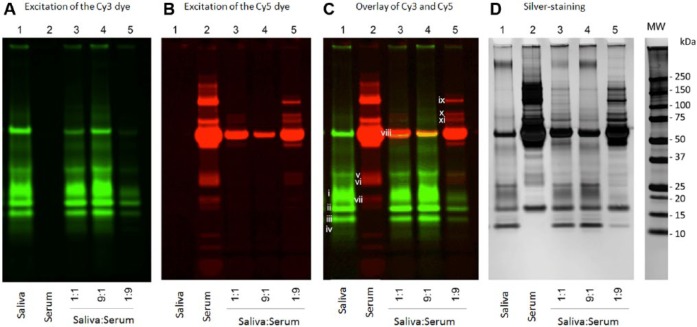
Figure 2.
Electrophoretic separation and visualization of CyDye-labeled proteins from human whole saliva (Cy3) or serum (Cy5) adsorbed to hydroxyapatite. In each lane, 160 µL was applied. (A) Proteins visualized by excitation of the Cy3 dye. (B) Proteins visualized by excitation of the Cy5 dye. (C) Overlay of images in A and B. (D) Silver staining of the CyDye gel. Lane 1, whole saliva supernatant; lane 2, human serum; lanes 3 to 5: saliva:serum protein mixtures at 1:1, 9:1 and 1:9 (v/v), respectively. The excised gel bands are numbered i to xi. The experiment was conducted in duplicate.

