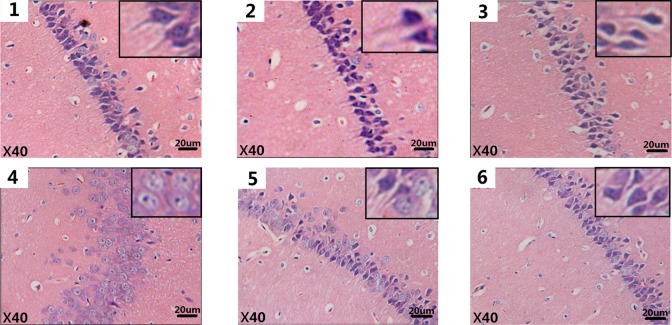
Figure 3.
Histological alterations (×40) seen in mice brains after SWCNTs exposure (H&E staining). Each of the 6 images (1-6) correspond to 1 of the 6 different exposure groups: 0, 3. 125, 6.25, and 12.5 mg/kg/d SWCNTs; 6.25 mg/kg/d SWCNTs + 100 mg/kg/d ascorbic acid (block group); and 100 mg/kg/d ascorbic acid, respectively. H&E indicates hematoxylin and eosin; SWCNTs, single-walled carbon nanotube.

