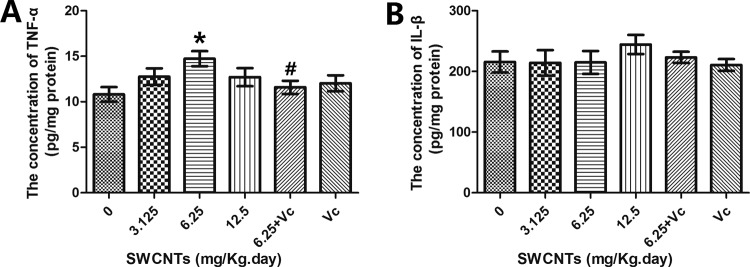
Figure 6.
Inflammation levels in mouse brains after SWCNTs exposure. A, The concentration of TNF-α. B, The concentration of IL-1β. *P < .05, compared with the control group (0 mg/kg/d SWCNTs), #P < .05, comparisons between the 6.25 mg/kg/d SWCNTs group and the block group (6.25 mg/kg/d SWCNTs + 100 mg/kg/d ascorbic acid). IL-1β indicates interleukin 1β; SWCNTs, single-walled carbon nanotube; TNF-α, tumor necrosis factor α.

