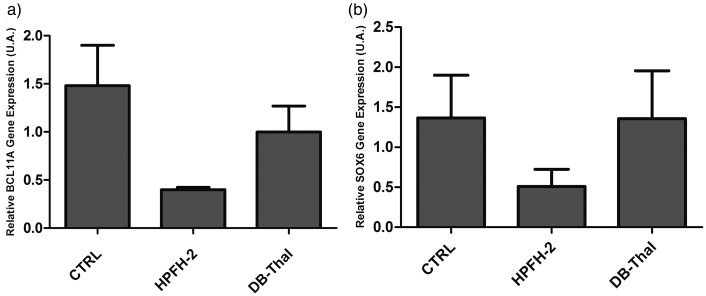
Figure 4.
Relative transcriptional levels of BCL11A and SOX6 mRNA, as evaluated by quantitative reverse-transcription PCR (qRT-PCR). (a) BCL11A mRNA expression in CD34; (b) SOX6 mRNA expression in CD34; Controls = CTRL (n = 3); subjects heterozygous for HPFH-2 = HPFH-2 (n = 2); patients heterozygous for Sicilian δβ-thalassemia = DB-Thal (n = 2)

