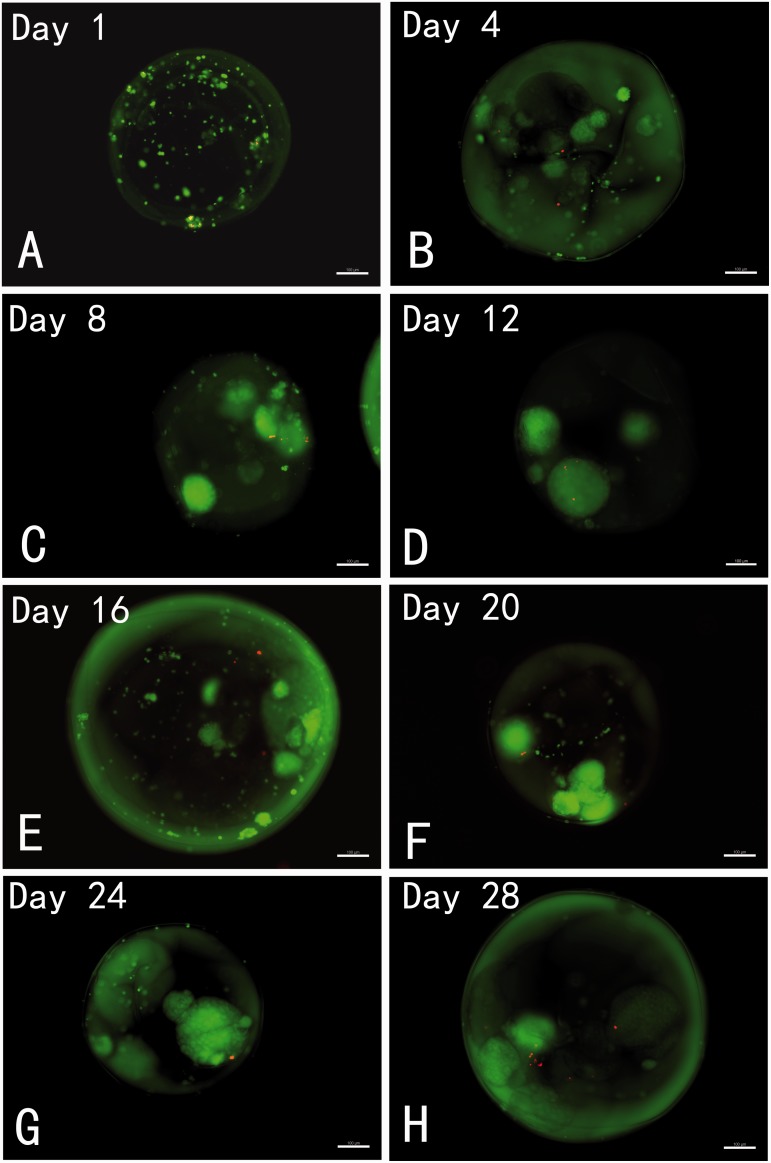
Figure 5.
Representative images of live/dead staining of encapsulated porcine thyroid cells with CFDA/PI dyes at designated time points: The live cells are represented by the green fluorescence of CFDA, and the dead cells are indicated by red fluorescence of PI. All images show good viability of the encapsulated cells throughout the various time points. The encapsulated thyroid cells formed spherical structures which were maintained during the experimental period with good viability. Scale bar on the images depict 100 µm. (A color version of this figure is available in the online journal.)

