
Figure 4.
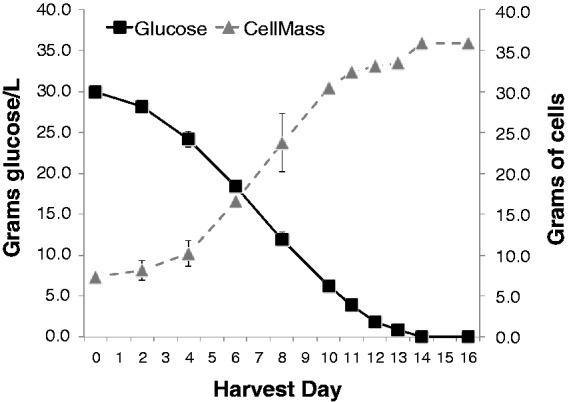
Cell mass (in grams) and glucose concentration (in g/L solution) in Amarillo cell line cultures over 16 days. Error bars (some not visible) represent SEM of 3–4 total replicates for each data point over the course of two independent experiments