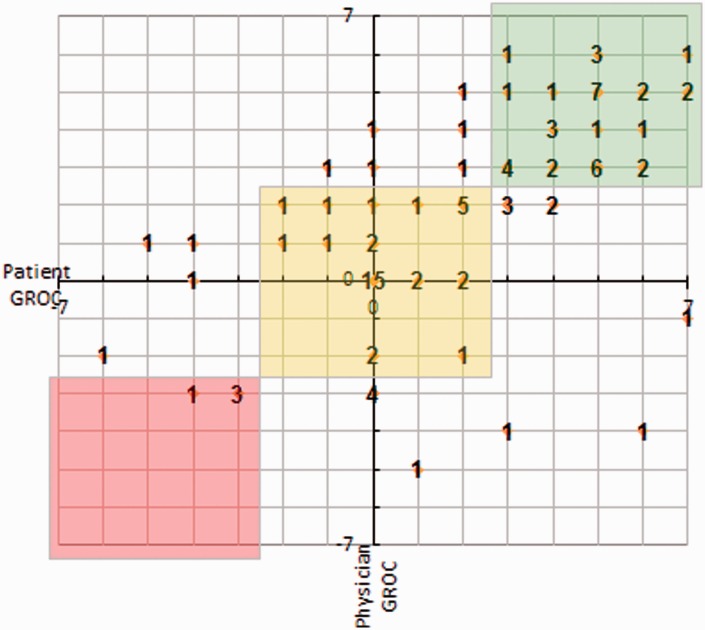
Figure 2.
Patient–physician agreement plot. Points that fall within the green (‘better’, n = 37), yellow (‘no change’, n = 35) and red (‘worse’, n = 4) boxes indicate that the patient and physician both rated the patient in the same category. Points that fall outside of the boxes indicate disagreement between the patient and physician (n = 23). The values represent the number of patients represented by that data point. GROC, Global Rating of Change.

