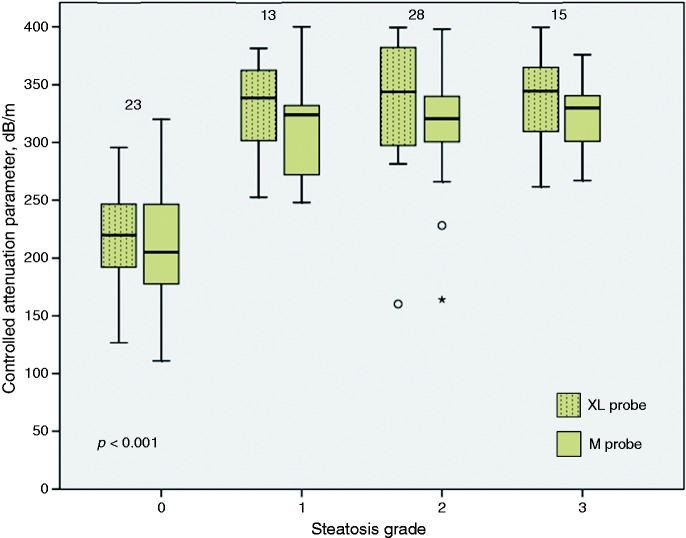
Figure 1.
Controlled attenuation parameter according to steatosis grade using the M probe and the XL probe.
The Kruskal-Wallis test was used for comparison across groups. The number of individuals in each steatosis grade is indicated at the top of the corresponding boxplot. There was one non-alcoholic fatty liver disease (NAFLD) patient and 22 healthy controls in the steatosis grade 0 group.

