
Figure 2.
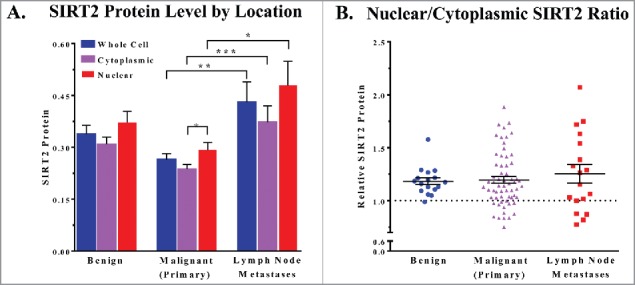
(A) Mean SIRT2 protein levels of whole cells, cytoplasmic, and nuclear cellular compartments are compared. (B) The ratio of the nuclear and cytoplasmic staining of the cells in each core was determined and the points are plotted by cancer status. Error bars represent mean ± SEM. * P ≤ 0.05; ** P ≤ 0.01 *** P ≤ 0.001.