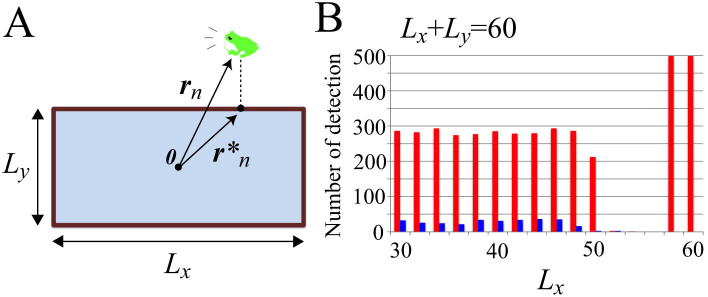
Figure 4. Numerical simulation on the stability of two-cluster antisynchronization and wavy antisynchronization.
The geometric shape of a field is assumed to be a rectangle, so as to replicate the shape of an actual paddy field in Japan. Parameters in equations (3) and (5)–(8) are fixed as ωn = 8π rad/s, N = 20, Knm = 1, and Lx + Ly = 60 m. (A) A schematic diagram describing the mathematical model. The two parameters Lx and Ly represent the length and width of the field, and  represents the vector from the origin 0, or the center of the rectangle, to the point on the edges that is nearest to the position of the nth frog rn. The nth frog is attracted to
  , according to Gn(rn) described by equation (3). In this simulation, Lx and Ly are varied with an interval of 2 m in the ranges of 30 ≤ Lx ≤ 60 and 0 ≤ Ly ≤ 30 under the constraint Lx + Ly = 60, and occurrences of two-cluster antisynchronization and wavy antisynchronization are calculated for 500 runs of the simulation with different initial conditions at each parameter set: namely, if only Rcluster is more than 0.9 at t = 30000, the dynamics is considered as two-cluster antisynchronization; if only Rwavy is more than 0.9 for one of k = −4, −3, −2, −1, 1, 2, 3, and 4 at t = 30000, the dynamics is considered as wavy antisynchronization. (B) Results of the numerical simulation on the stability of two-cluster and wavy antisynchronization. Red bars represent the numbers of detection of two-cluster antisynchronization, and blue bars represent those of wavy antisynchronization among 500 runs of the simulation. Two-cluster antisynchronization is more frequently observed than wavy antisynchronization, except for the cases of (Lx, Ly) = (52, 8), (54, 6) and (56, 4). The diagram of Figure 4A was drawn by I.A.

