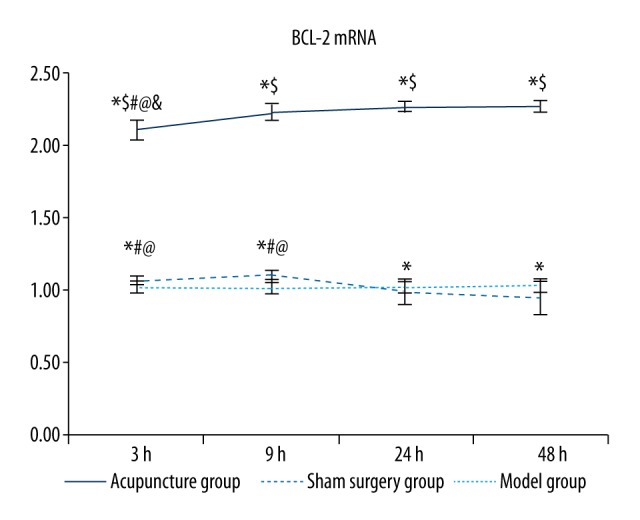
Figure 5.

Comparisons of BCL-2 mRNA levels between groups. Between groups: compared with the sham surgery group * p<0.05, compared with the same time point model group $ p<0.05; within the group: compared with the 48 hour group # p<0.05, compared with the 24 hour group @ p<0.05, compared with the 9 hour group & p<0.05.
