Figure 8.
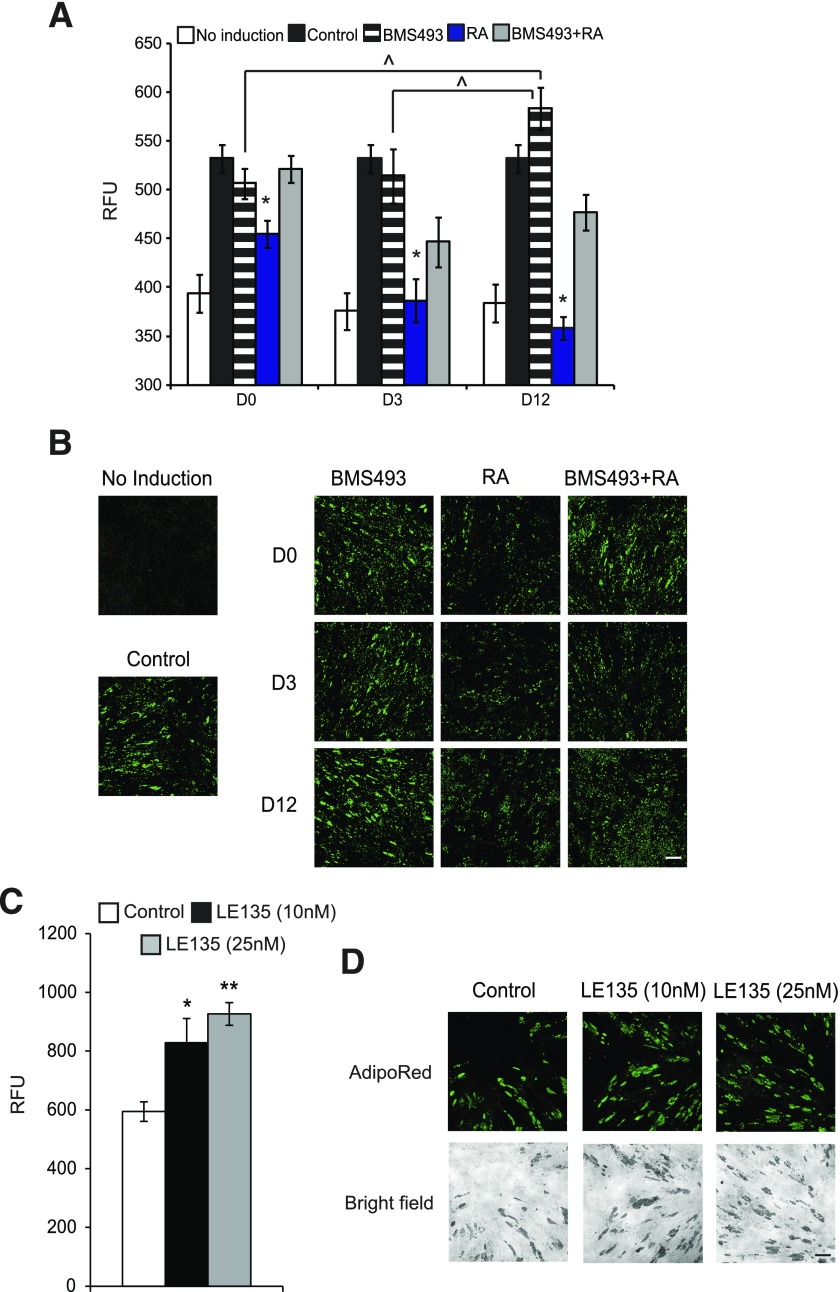
RA-mediated adipogenic defects are reversed by the antagonism of the downstream target RAR. A: A representative graph showing the relative fluorescence units (RFUs) of AdipoRed staining on VS ASCs from S11. Adipocyte differentiation was induced in ASCs using a standard adipogenic cocktail with or without pretreatment/treatment with BMS493 and/or RA at various time points. The ASCs were treated with 1 μmol/L of BMS493 and/or 10 μmol/L of RA at the time points indicated: D0 (D−2 to D0), D3 (D−2 to D3), and D12 (D−2 to D12). *P < 0.05 and ^P < 0.05 denote significant fold change in RFUs corresponding to the quantitation of lipid accumulation during adipocyte differentiation (n = 2). B: Representative images (original magnification ×10) showing lipid accumulation (AdipoRed, green) in VS ASCs from S11 treated with 1 μmol/L of BMS493 and/or 10 μmol/L of RA at the different time points indicated: D0 (D−2 to D0), D3 (D−2 to D3), and D12 (D−2 to D12). For the purpose of presentation, the fluorescent intensities were enhanced to the same degree for all images. Scale bar = 100 µm (n = 2). C: A representative graph showing the RFUs of AdipoRed staining on VS ASCs from S11. ASCs were treated with LE135 (10 or 25 nmol/L) for 3 days upon the induction of adipogenic differentiation with a standard adipogenic cocktail. *P < 0.05 and **P < 0.01 denote significant fold change in RFUs (n = 2). D: Representative images (original magnification ×10) showing lipid accumulation (AdipoRed, green) in VS ASCs from S11 treated with LE135 (10 or 25 nmol/L) for 3 days upon the induction of adipogenic differentiation. For the purpose of presentation, the fluorescent intensities were enhanced to the same degree for all images. Scale bar = 100 µm (n = 2). Similar results were obtained from experiments using cells from S12.

