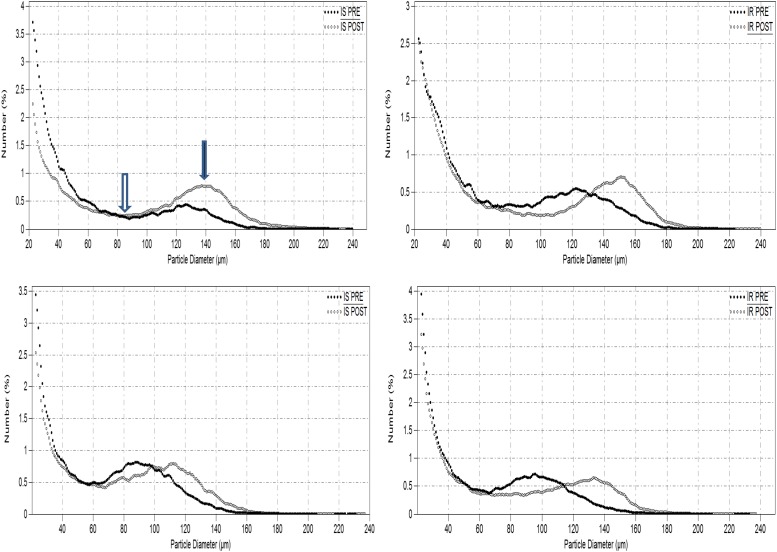
Figure 1.
Representative Beckman Multisizer profiles for adipose cell size distribution are shown in two IS and two IR subjects at baseline (PRE) and at peak weight (POST). Nadir, indicated by open arrow, separates two populations of small cells, distributed as a double exponential tail to the left of nadir, and large cells, distributed as a Gaussian curve. The black arrow indicates peak diameter (center of Gaussian curve).

