Figure 3.
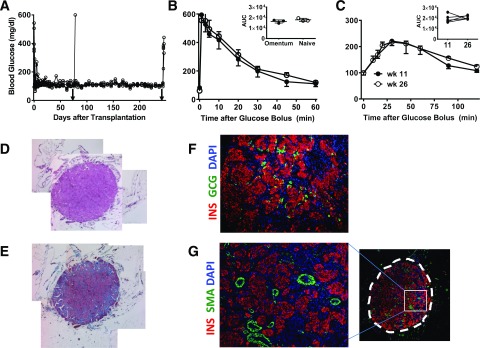
Intraomental islets transplanted into biologic scaffolds restore normoglycemia in diabetic rats. A: Nonfasting blood glucose levels in diabetic rats (n = 7; 173.4 ± 91 g body wt) transplanted with 3,000 IEQ (17,338 ± 881 IEQ/kg) onto the omentum showing prompt reversal of diabetes and hyperglycemia after removal of the omental graft (arrowhead) on POD 74 (n = 1) or 240 (n = 4). B: Glycemic profile during IVGTT performed in selected animals (n = 3) 2 months after transplant compared with that of naïve animals (n = 3). Values shown are mean ± SD. Inset shows area under the curve (AUC) (mg × min × dL−1) for each group. C: Glycemic profile during OGTT performed in transplanted animals (n = 5) at 11 (●) and 26 (○) weeks after transplantation. Inset shows AUC (mg × min × dL−1) during the glucose challenge. D–G: Representative histopathologic pattern of intraomental islet grafts. Sections were obtained from an intraomental islet graft explanted on POD 76. D: Hematoxylin-eosin staining. E: Masson trichrome staining. F and G: Immunofluorescence microscopy of a section stained with anti-insulin (INS) (red fluorescence), anti-GCG antibody (green fluorescence) (F), anti-SMA (green fluorescence) (G), and nuclear dye DAPI (blue fluorescence). The box indicates the area of the graft shown at higher magnification on the left panel. wk, week.

