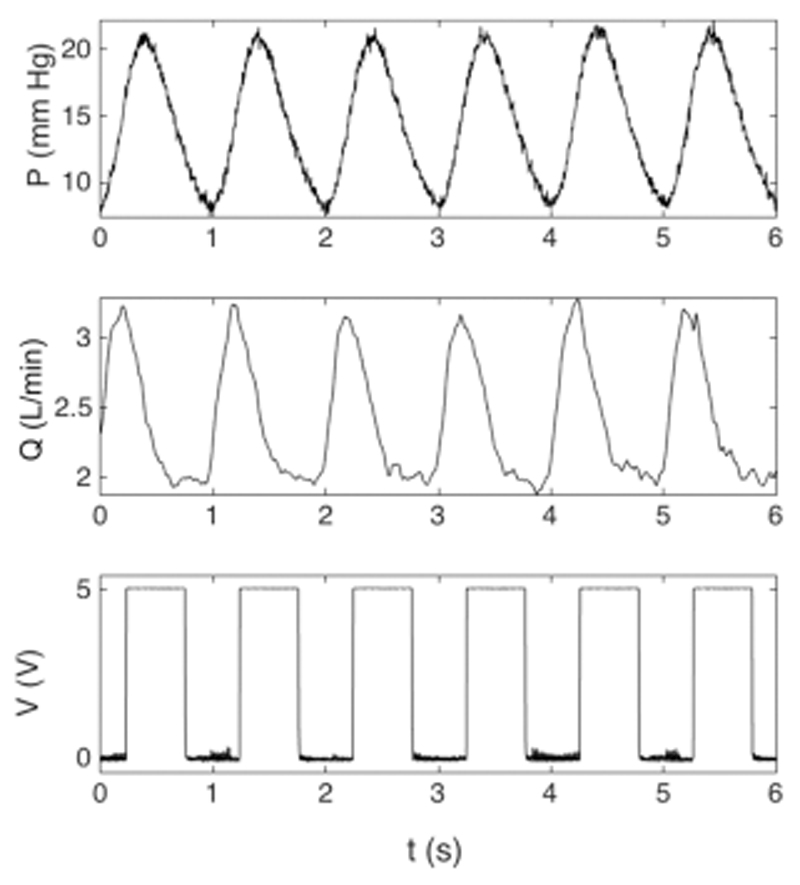
Figure 3.
Example of typical pressure, flow, and trigger signals, as part of a longer acquisition. Pressure was measured in the MPA, flow at the inlet, and the trigger signal, that is, square wave, that originated from the pump. For 10 consecutive beats, mean pressure was 15.2 ± 0.1 mm Hg with peak systolic pressure of 22.4 ± 0.2 mm Hg and minimum diastolic pressure of 8.2 ± 0.2 mm Hg, mean flow rate was 2.6 ± 0.02 L/min with peak systolic flow rate of 3.3 ± 0.04 L/min and diastolic flow rate of 1.9 ± 0.03 L/min, and DTF is 50%.

