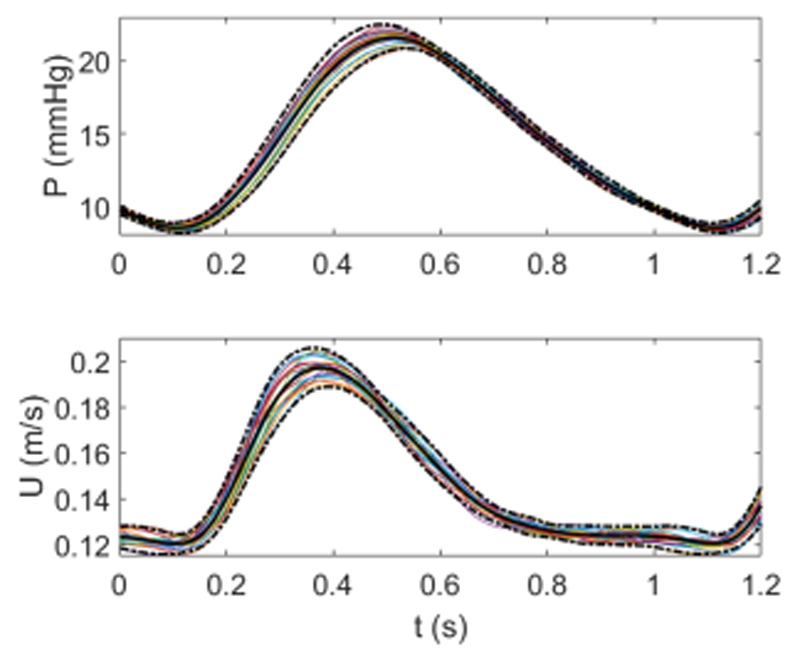
Figure 4.
Ensemble averages for the aligned pressure (measured in the MPA) and velocity (measured at the inlet) for 20 beats. Each beat is shown by a colored line and the solid black line and dotted black lines represent the ensemble average and 95% confidence intervals, respectively. [Color figure can be viewed in the online issue, which is available at wileyonlinelibrary.com.]

