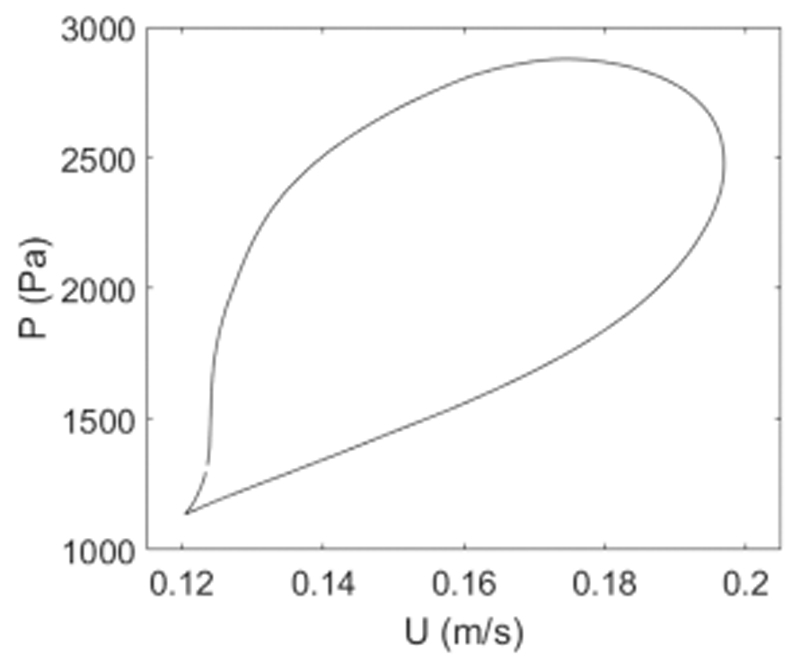
Figure 5.
Pressure-velocity (P-U) loop of ensemble averaged flow velocity and pressure data. For WIA, flow velocity data was shifted until a linear slope is observed in early systole as displayed here. Wave speed was calculated from the slope of the linear segment this graph on the basis of the water hammer equation and was 10.7 ± 0.1 m/s, based on 10 measurements for this case.

