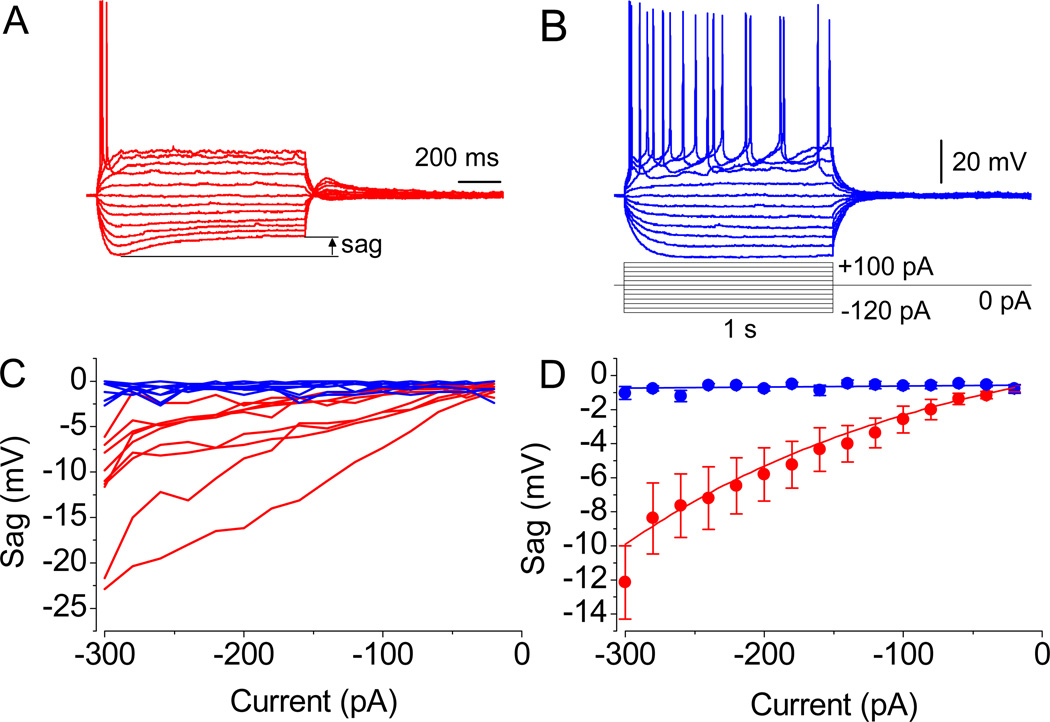
Fig. 2.
Action potential waveforms. (A and B) Evoked APs in two different neurons. Note the significant sag in MP in A and its absence in B, as revealed upon the injection of currents of relatively low amplitude. (C) Representation of sag’s magnitude from all recorded neurons. (D) The mean amplitude values in cells with properties resembling the one shown in A (n = 9, P < 0.01 at −300 to −40 pA, paired t test) and B (n = 9, P = 0.5). Resting membrane potential was −55.2 mV in A and −52.2 mV in B. Identical scale bars are shown.

