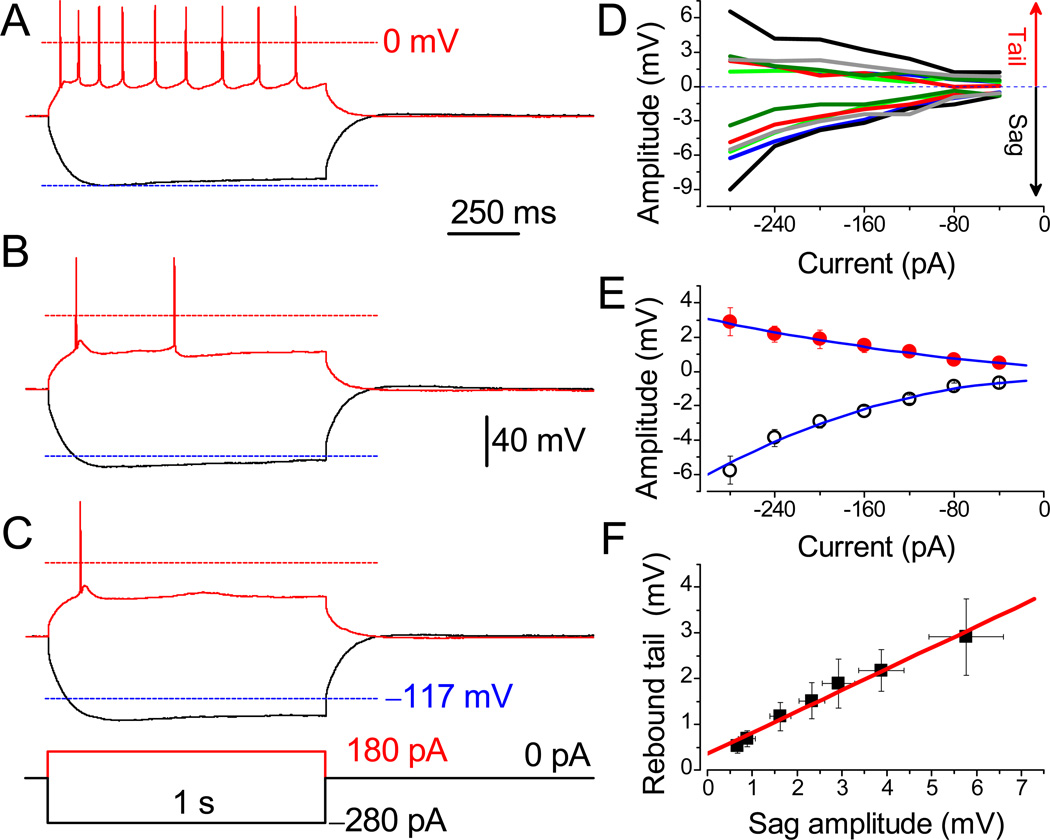
Fig. 4.
Suppression of evoked action potentials by nicotine in a subset of neurons. APs were evoked in LS neuron before (A) and after (B) treatment with 3 µM nicotine, and after 30 min wash-out (C). The APs were evoked from the RMP of −60.1 mV under identical conditions. Lower dashed lines are MP at −117 mV. Identical scale bars apply for A–C. (D) The sag and rebound tail potentials in different neurons are color-matched. (E) Mean amplitudes of rebound tail (●) and sag potentials (○, n = 6). Note that the amplitude of sag is two-fold greater than the tail potential. (F) The linear correlation between values of sag and tail potentials (R = 0.99).

