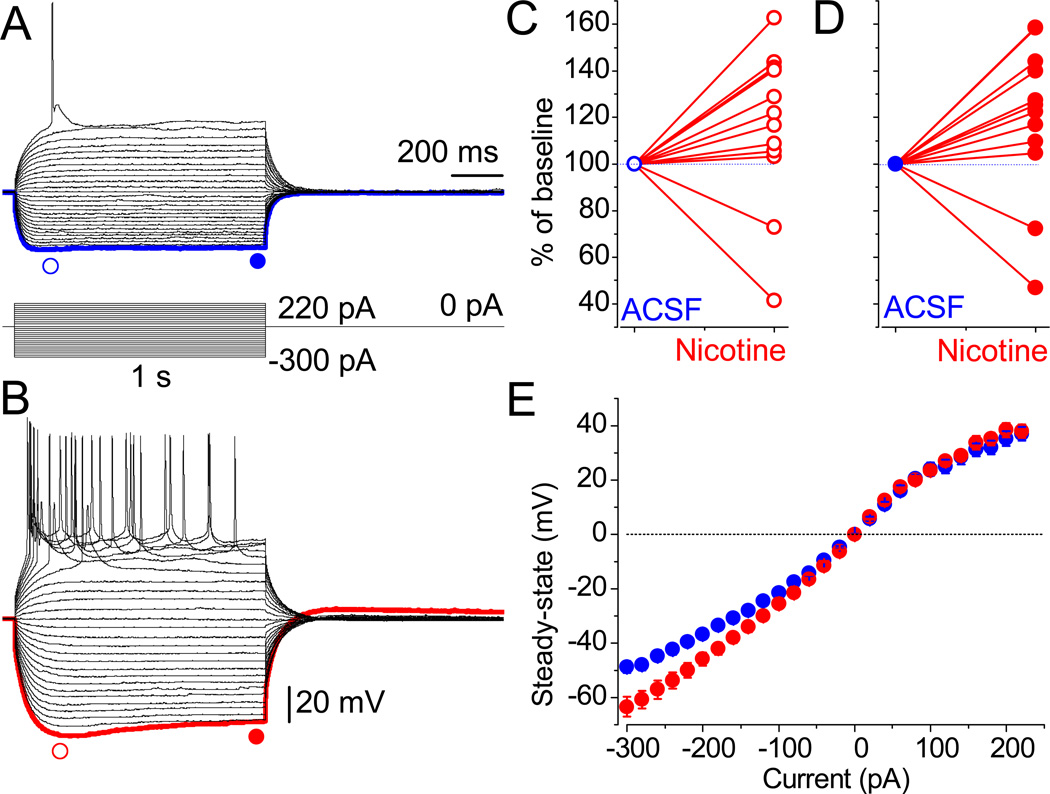
Fig. 5.
Nicotine-mediated sag. (A) The MP in neurons of the LS was recorded in response to hyperpolarizing currents under identical conditions, as in Figure 2. (B) Within 15 min of exposure to nicotine, sag and related rebound tail potentials appear. Scale bars for A and B are identical. The blue and red symbols indicate the points taken for statistical analyses. (C and D) The individually normalized peak and steady-state amplitude values for all tested neurons. (E) The mean amplitude values of the steady-state potentials were increased by nicotine only at more hyperpolarized MP (for example, at −200 pA: −45.8 ± 2.4 mV vs. −36.8 ± 1.7 mV, n = 10, P = 0.001). Error bars are very small under control conditions.

